6.3.14. Waterfall
A waterfall chart visualizes data in a way that makes it easier to understand the cumulative sequence of positive additions and subtractions that produces the final value.
This type of chart is particularly useful in financial analysis, for example, when showing how different revenue and expense components affect a company’s net profit over a given period. It is also used to understand the differences between budget forecasts and actual results and to break down the differences between two periods.
Waterfall charts quickly identify the main components that have the biggest impact on the final result. This is particularly useful for decision-makers and analysts trying to understand the dynamics underlying their financial or operating data.
6.3.14.1. Configuring a waterfall chart
Creating a waterfall chart in Tale of Data is very easy. Simply prepare your raw data and let Tale of Data do the rest.
Let’s take as an example a dataset in which each row represents a purchase in a US store:
Tale of Data lets you build a waterfall chart without having to transform the data yourself, as is usually the case with this type of chart.
Let’s suppose we want to analyze the variation in sales between two consecutive quarters by looking at the contribution each category makes to the variation.
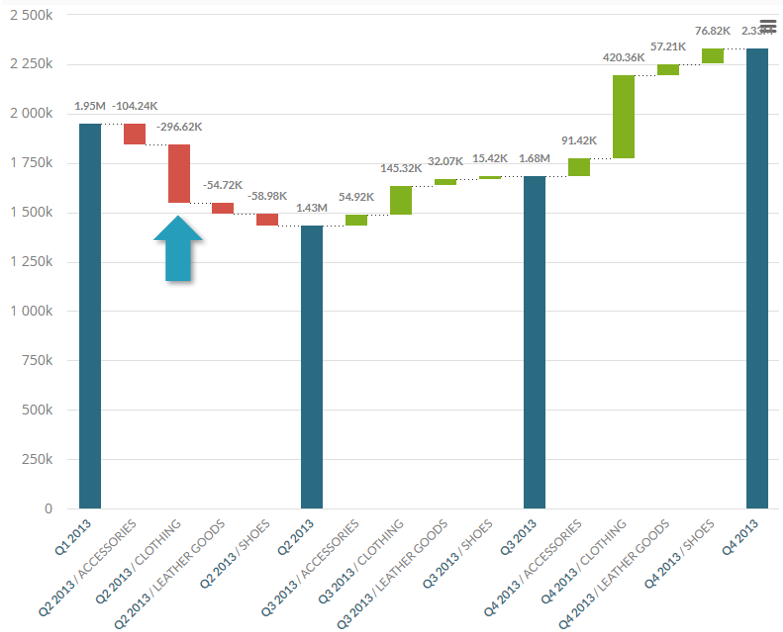
The chart above clearly shows that:
Sales fell (from €1.9 million**to **€1.43 million) between the first and second quarters of 2013
CLOTHING made the biggest contribution to the fall (-€ 296 620 when compared to sales in the same category the previous quarter)
To build the chart, you first need to select a waterfall chart from the drop-down chart configurator:
Then specify 3 columns.
Steps column
This represents the steps in the Waterfall (dark blue in the chart). These are “summary markers” for aggregating calculated values (here, total sales).
In our example, a step is a sales quarter. To configure it, just drag and drop the order_date column to Steps in the chart configurator.
Aggregation is monthly by default. To specify quarters, click the blue widget we just dragged to Steps in the chart configurator and select quarter:
Category column
This is the column used to calculate variations in sale amounts between steps. The variation bars in the chart will be green for increases and red for falls.
In our example we will chose the Product_Category column that we will drag to Category in the configurator.
Measurement column
This third and final column contains the values to be aggregated. In our example, it is the Amount column, which must be dragged to Measurement in the configurator. By default, Tale of Data aggregates by amount, which is precisely what we want here.
That’s it! If your configurator looks like the one below, your first waterfall will display without you having to prepare any data.
6.3.14.2. Waterfall and drill down
In the previous example we had just one level of detail (the Product_Category column) for looking at how contributions to sales differed over two quarters.
Tale of Data makes it simple to add levels so that you can browse the waterfall by level. Just drag one or more columns to Details. We’ll use the Product_Sub-category column:
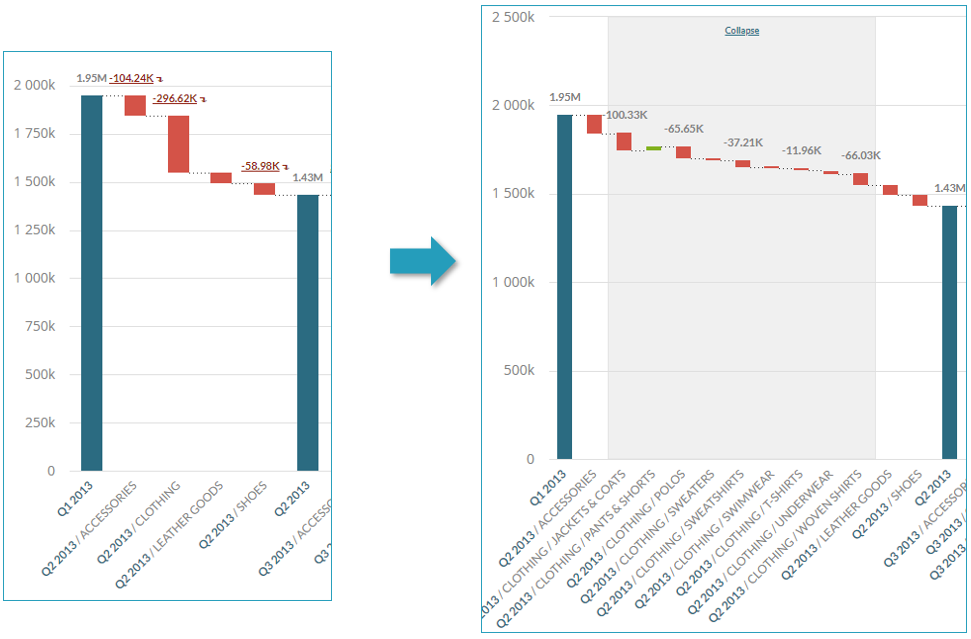
Now click on the (red and green) variation bars to go down a level from Product_Category to Product_Sub-category):
To browse by level:
Click the bar in which you want more detailed information, in this case on the drop in clothing sales (-€296 620) between the first and second quarters of 2013
In the gray zone that appears you will see details of the clothing sub-categories that explain the -€296 620 drop. You will note in particular that only PANTS & SHORTS saw any increase in the second quarter.
Click anywhere in the gray zone to close the level.
Note: There is no limit on the number of levels you can use. However, after 2 or 3 drill-down levels, the chart gets harder to understand.


