6.4. Using dashboards
6.4.1. Display the list of dashboards
In Dashboards, he list of available dashboards is accessed with  :
:
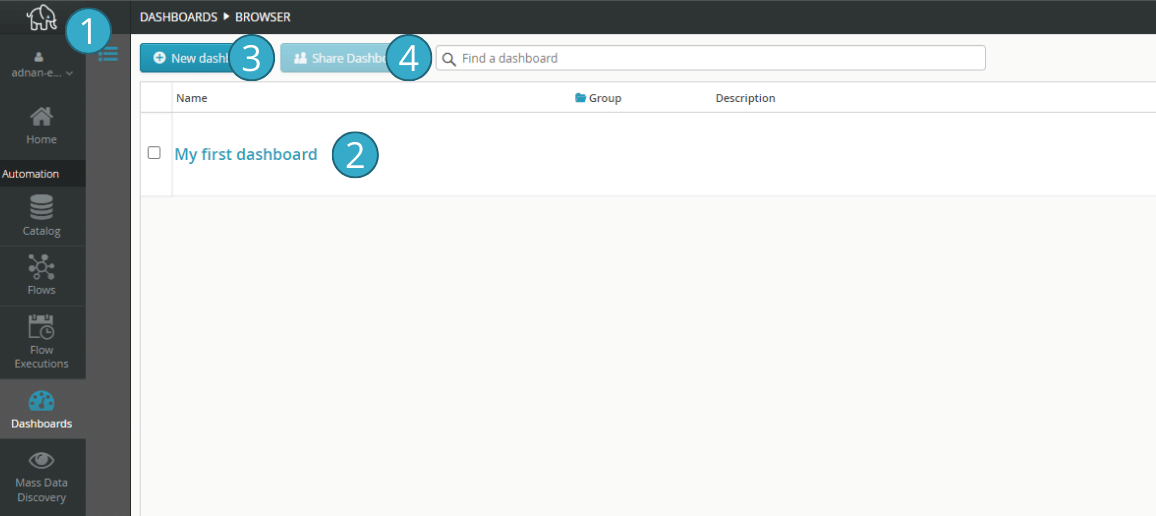
To the right of  , a number of buttons on each dashboard let you perform certain tasks:
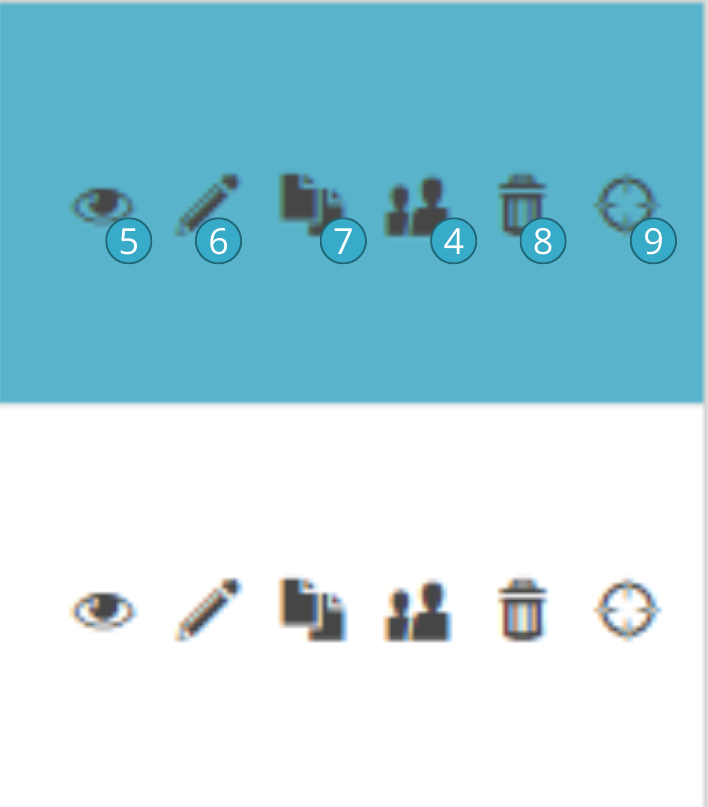
The buttons shown will depend on the rights the Tale of Data user holds to the dashboard in question:
if the table is being shared, the user will only be able to open or delete it
if the user is also the author of the table, the other functionalities will be available
6.4.2. Sharing a dashboard
Using the  above, it is very easy to share the dashboards you have created with other Tale of Data users as they link to a share interface, similar to those used to share catalog sources and flows.
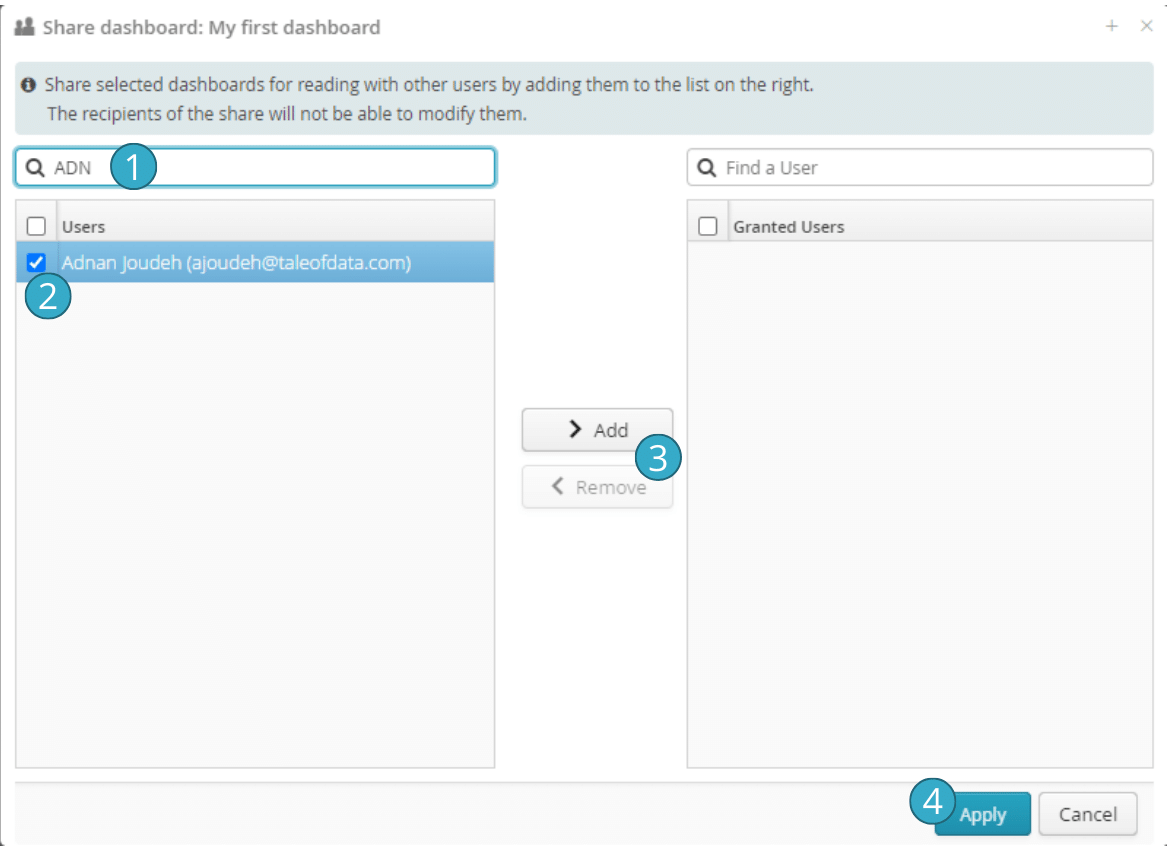
 Buttons for adding or deleting selected users from the list of those with whom the share has been made.
The shared dashboard will appear on the share beneficiary’s list of dashboards. The beneficiary will be able to consult it, to use all the sort and filter functions and to download the charts and tables made available. The beneficiary will not however be able to alter the dashboard by e.g. renaming pages or charts or to change their configuration. The share will not allow access to the sources of catalog data feeding into the dashboard. Responsibility is therefore clearly divided between dashboard administration and the users of the information in the tables.
Note
if you give the URL of a dashboard to another user, you must share the table with that user before it will work.
Note
Tale of Data offers a range of licences that allow different actions with dashboards:
Type of licence |
Consult a table |
Create a table |
Share a table |
|---|---|---|---|
Dashboard Reader |
x |
||
Personal |
x |
x |
|
Business |
x |
x |
x |
For further information, please contact Tale of Data.
6.4.3. Interactive dashboard browsing
When you have opened a dashboard to view it, you can browse its pages, documentation and charts:
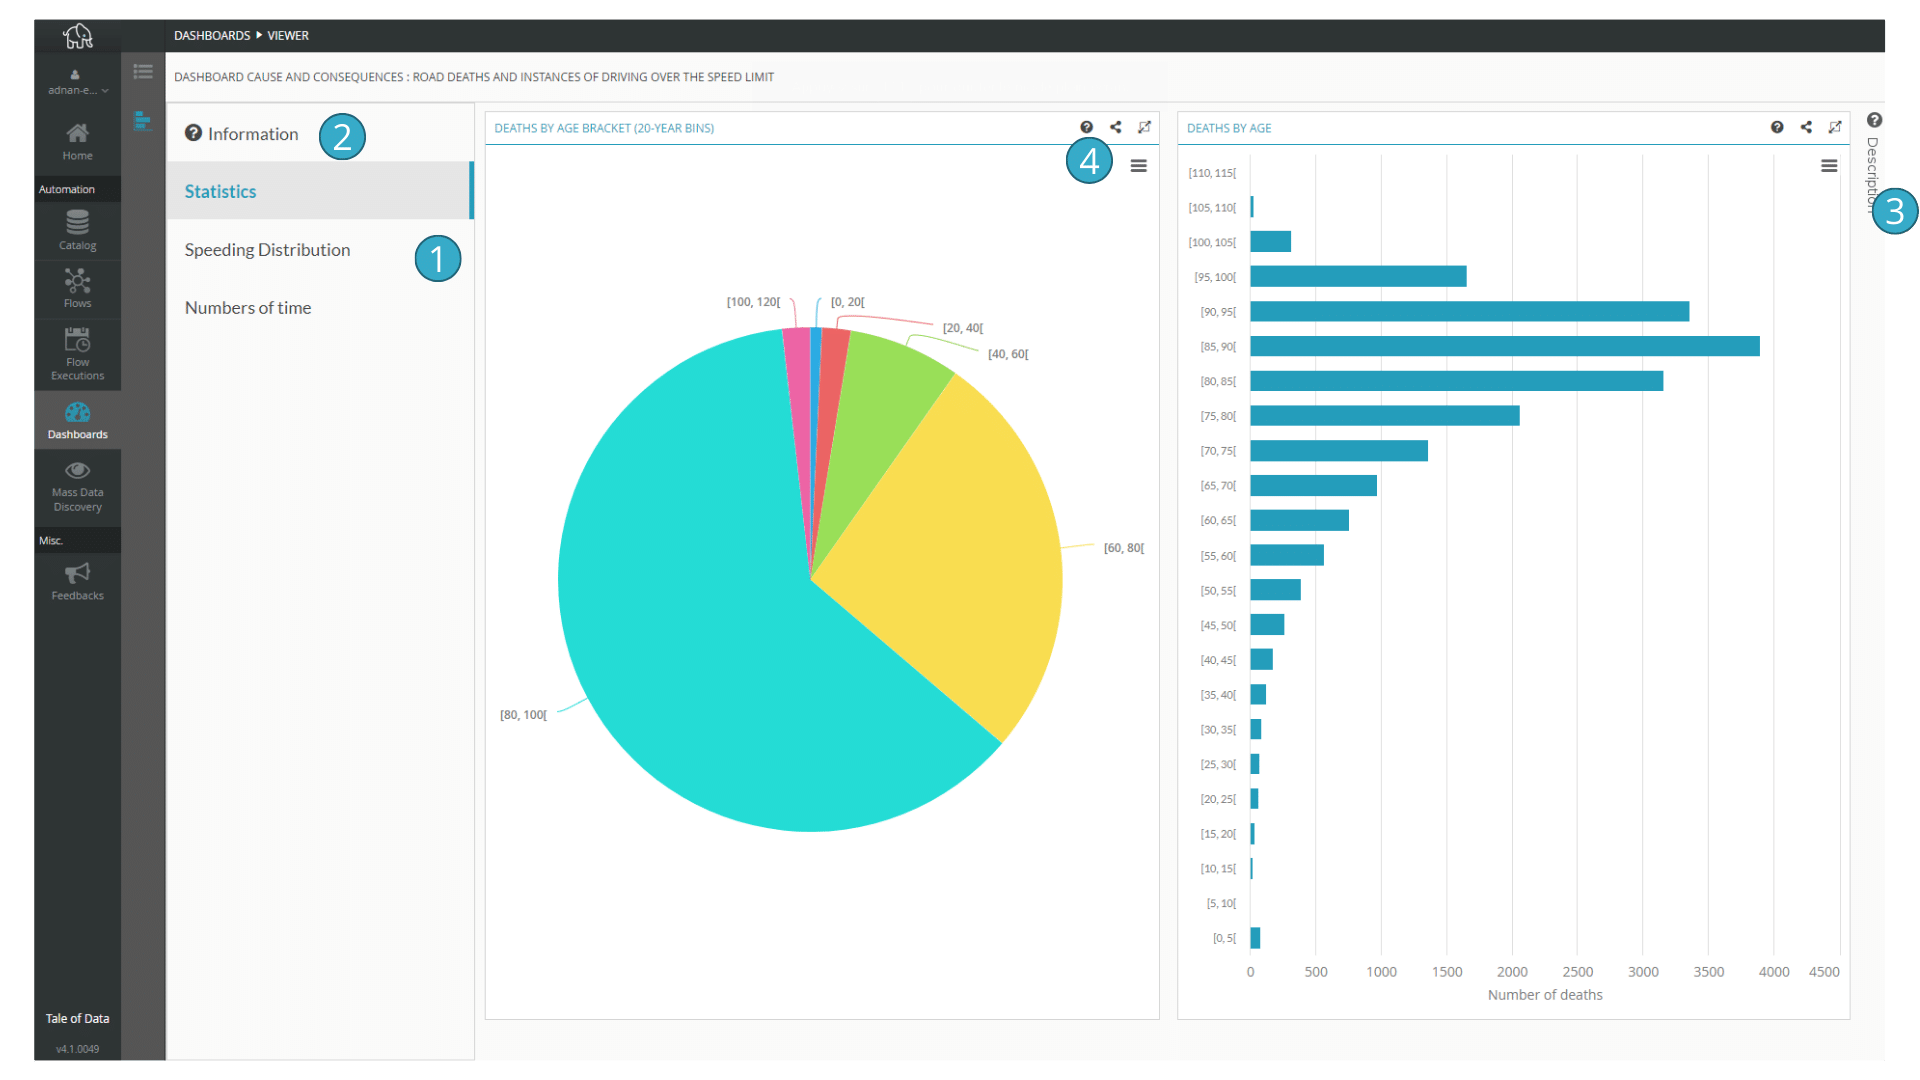
 Display dashboard description (appears if a dashboard description has been configured)
 Bar displaying a description of the page (appears if configured)
 Display a description of the individual chart concerned (appears if configured)
Each chart has individual buttons:
6.4.3.1. Share the URL for a particular dashboard or chart

With  Tale of Data gives you a unique URL that will take its user to the chart concerned.
In view mode you can also simply copy your browser’s URL when you are in view mode into the dashboard you want to share. The URL will then link to the first page of the dashboard and not to a specific chart.
Note
The URL can only be used by valid licence holders with whom you have shared the dashboard. This ensures access to the data provided via a dashboard is secure.
The Dashboard Reader licence is a very affordable solution allowing basic access to people who want to use dashboards without having to learn how to use Tale of Data.
6.4.3.2. Downloading a chart

With  , a range of download options is offered for retrieving the chart in the form of an image, an Excel file if it is a table or a pivot table.
Hint
- While dashboards do not allow access to the sources of the catalog data feeding into them, they do allow users to download data that is visible on the dashboard. In effect, you may wish to use flows to prepare data before it is displayed, to share aggregated or pre-filtered information and to check the confidentiality of data and information shared via dashboards. Flows can be used to, for example:
present aggregated information on groups of people rather than on individuals
anonymize data before presenting it
