Getting Started Guide
Note
A video tutorial for this section of the documentation is available here.
Tale of Data is a software program designed for business users to restore their confidence in their data and therefore enable them to make good decisions.
Tale of Data offers the following functions that do not require coding:
Intelligent data reliability,
Data compliance control,
Discovery of the datasets disseminated in the Information System,
Semantic mapping (nature of data) and anomaly mapping,
Combination of heterogeneous data sources, data augmentation,
Automated monitoring, notifications and remediation.
Basic principles
Audited, business-verified data for informed decision-making that maximises results and minimises risk!
Definitions
- Flow
A flow is a graphically designed form of processing made up of:
Input data,
A set of transformations,
Output data.
- Node
A node is represented by icons in a flow.
Nodes are used to represent, for example:
Tale of Data icons
Tale of Data icons are there to help you.
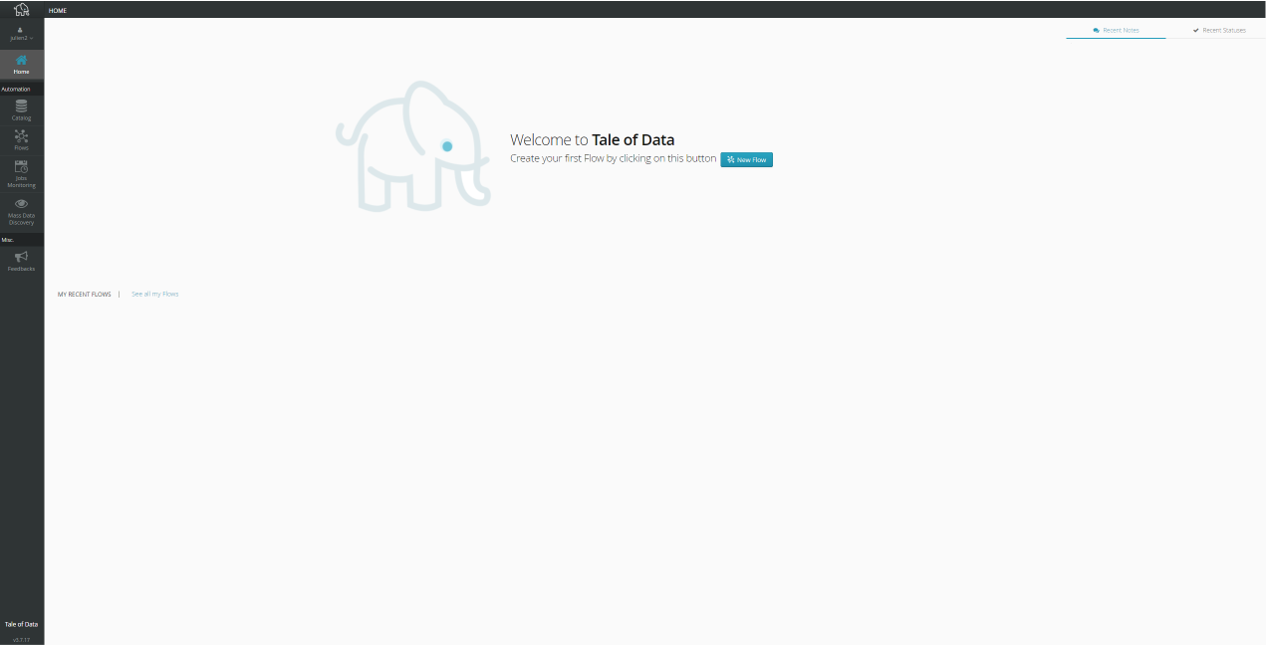
Home page
Enter your login and password to display the home page.
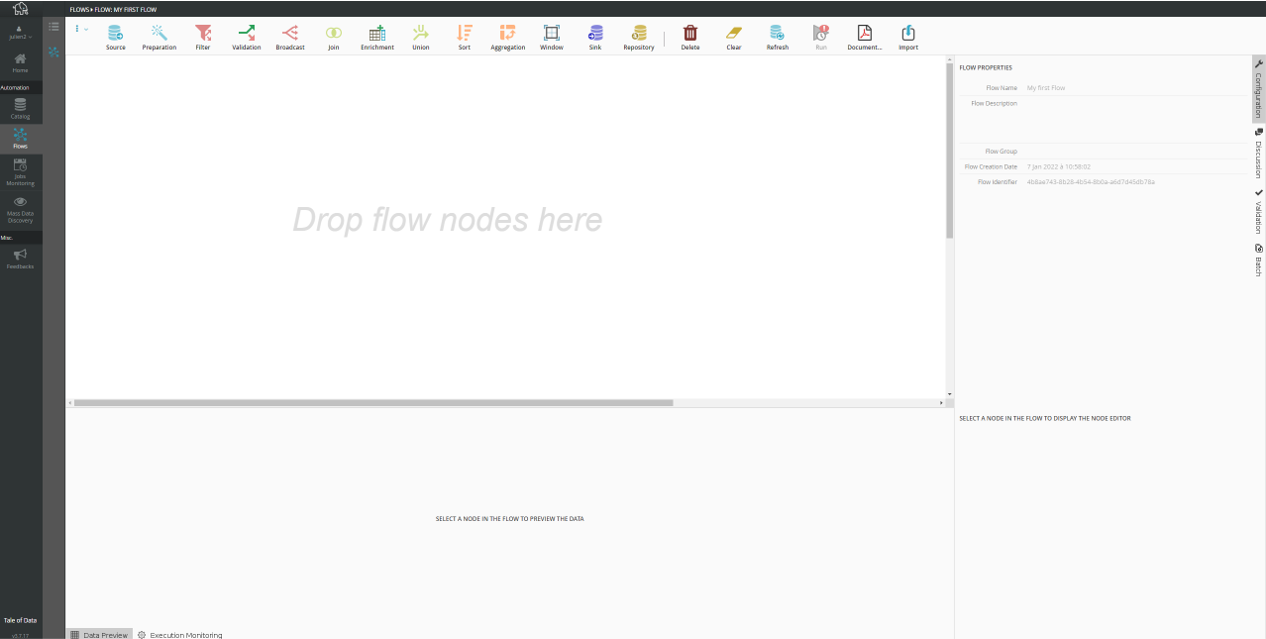
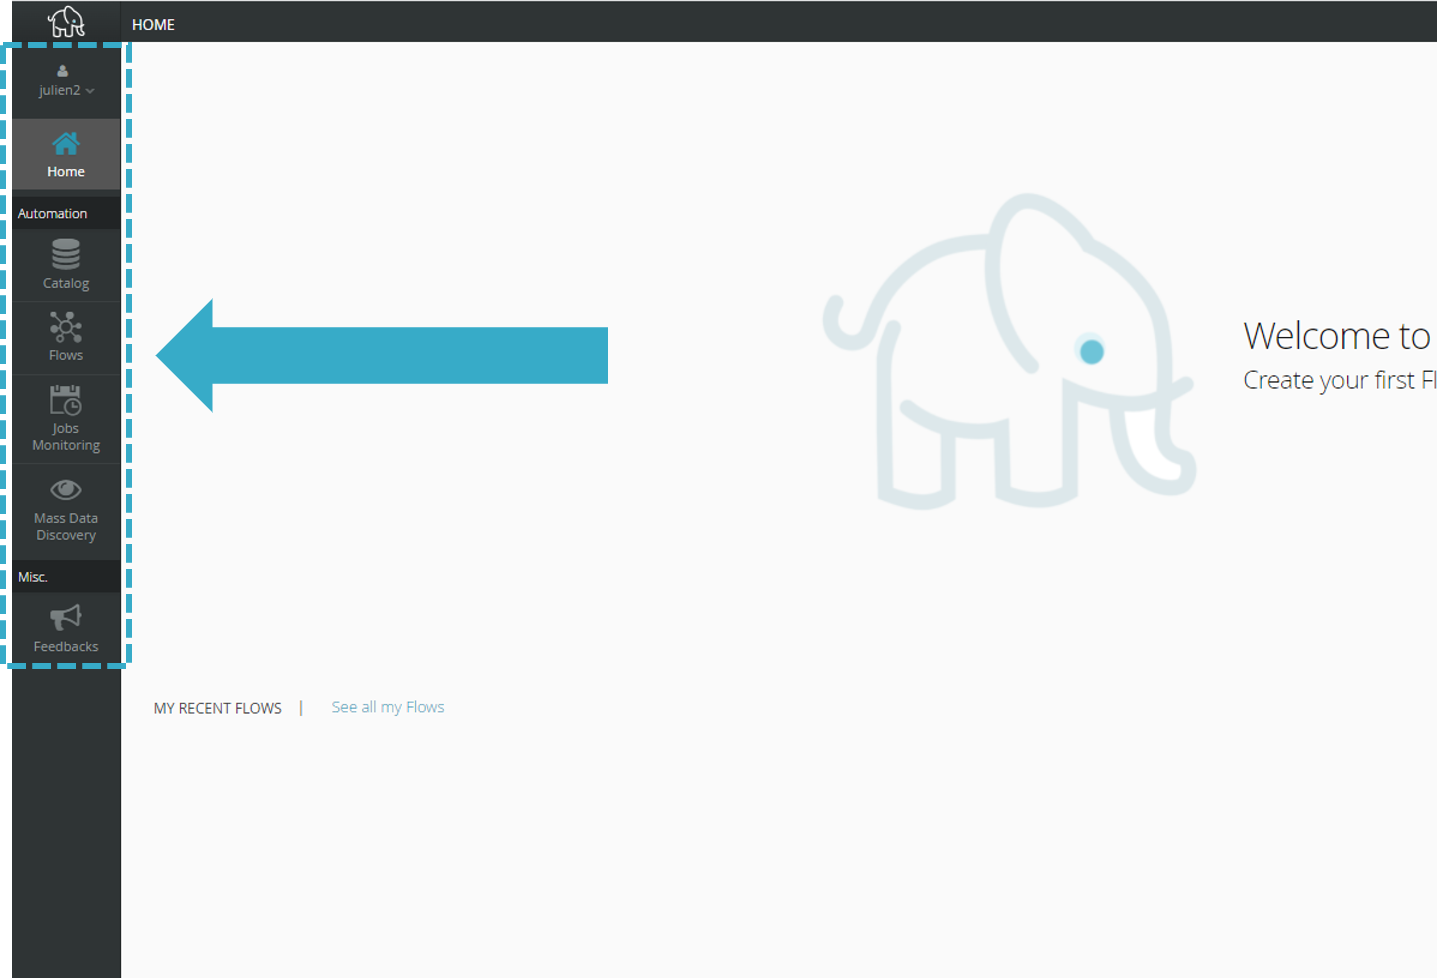
The Tale of Data main menu is always visible on the left of the screen.
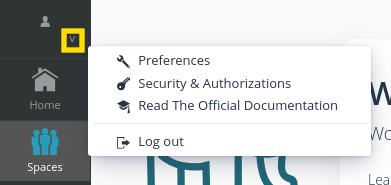
Go to the menu by clicking your user profile (top left) to:
Set user preferences
Configure external services authorizations and API keys
See the official Tale of Data documentation
Log out
Set user preferences
Access to user preferences allows :
Choose the UI language of Tale of Data
Define the Datetime Display Format
Define the Datetime Write Format
Define the Flow view style
Catalog
Access the catalog from the main Tale of Data menu to:
access datasets
access the list of repositories
add new data sources
Creating your first flow
My first flow
Start from the beginning: learn how to build and run a flow in Tale of Data.
Aim
As part of this Getting Started Guide, we are going to create a simple flow. We will take data from a file, filter some rows and write the results to a different file.
To do this, you must create and configure:
Hint
The flow will familiarise new users with Tale of Data concepts and help them get started. The full potential of Tale of Data will become clear with practice.
Creating the flow
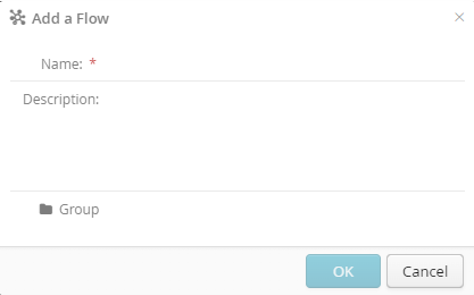
In the home page:
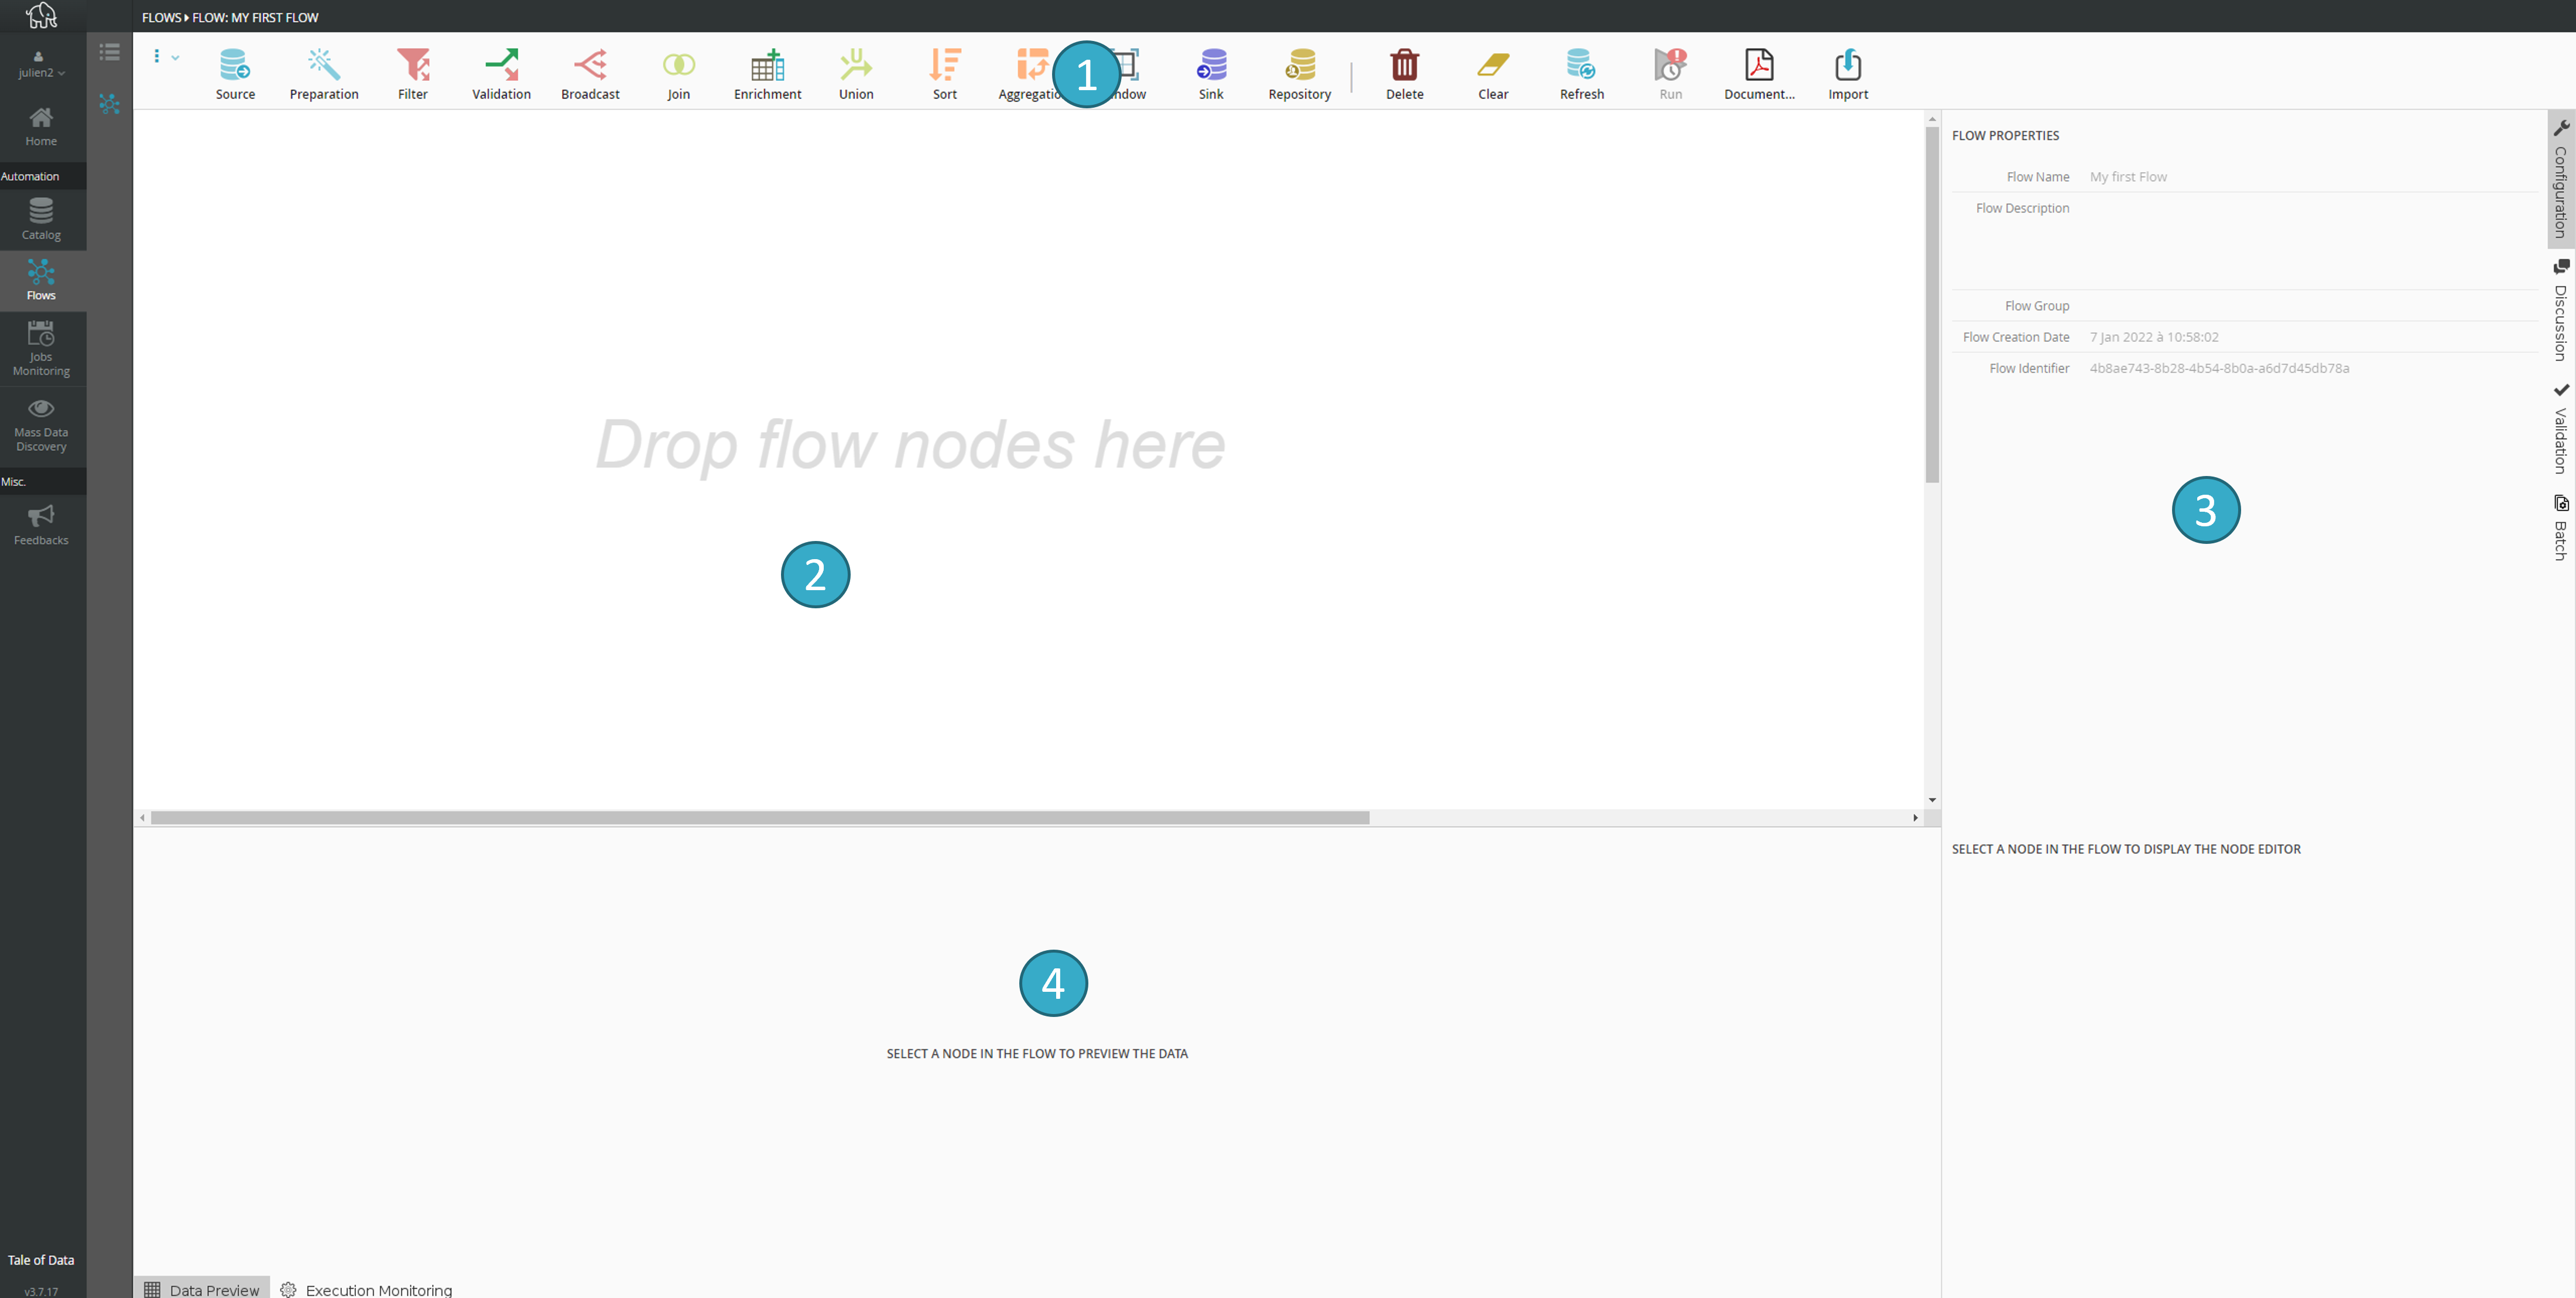
Flow Designer
Hint
This is a partial preview and only covers a sample of rows.
Adding a data source
Drag and drop the source node icon  from the toolbar to the canvas.
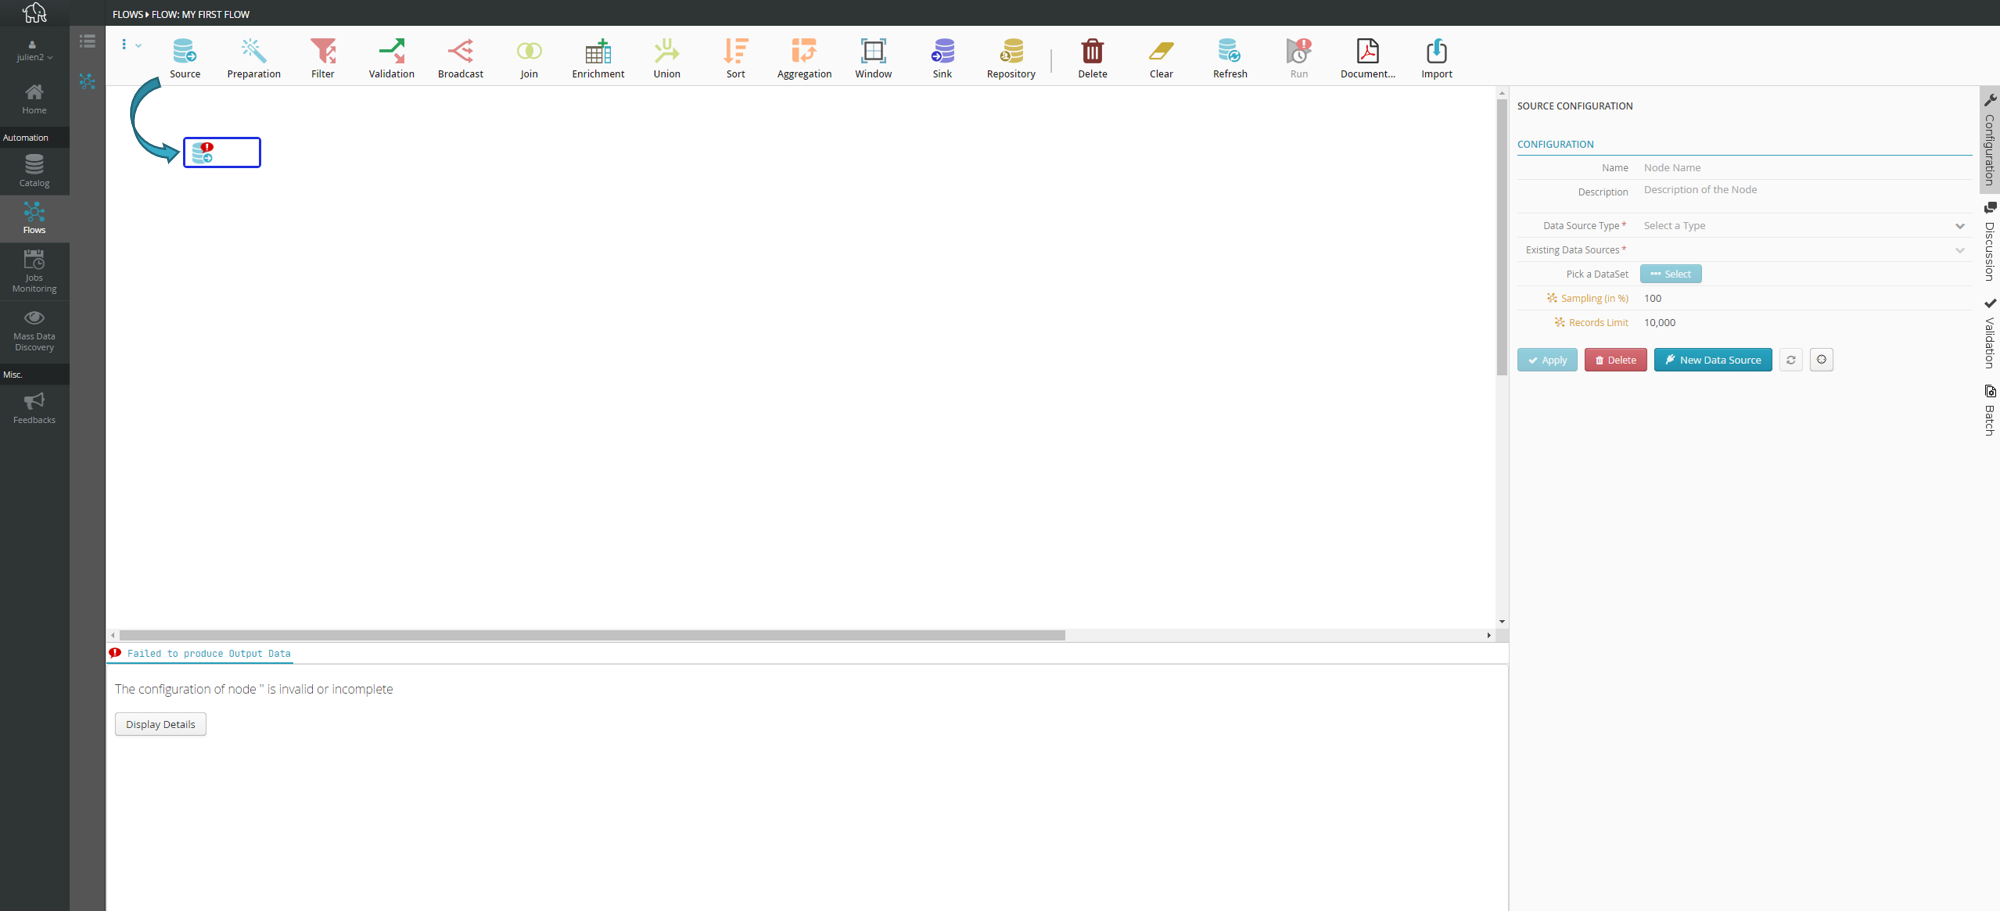
A source node  lets you retrieve records (by connecting to files or databases).
Configuring the source node
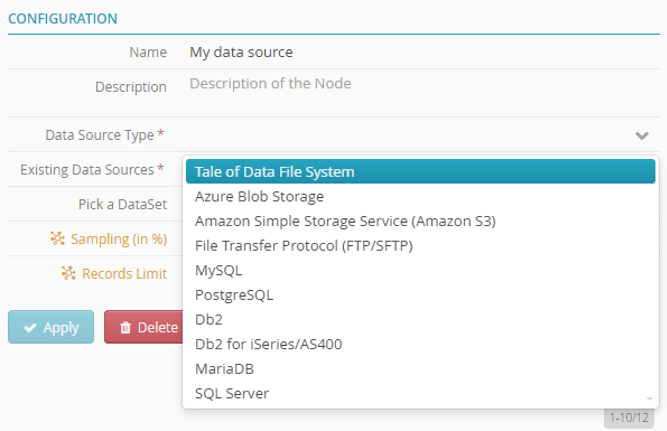
You may be able to name your source node
 .
.For example: “My data source”
If you do not do this, the node will automatically take the name of the selected file or table.
In “Type of Data Source”, select Tale of Data file system.
Note
The Existing Data Sources field auto completes.
Click Select

A new window will open
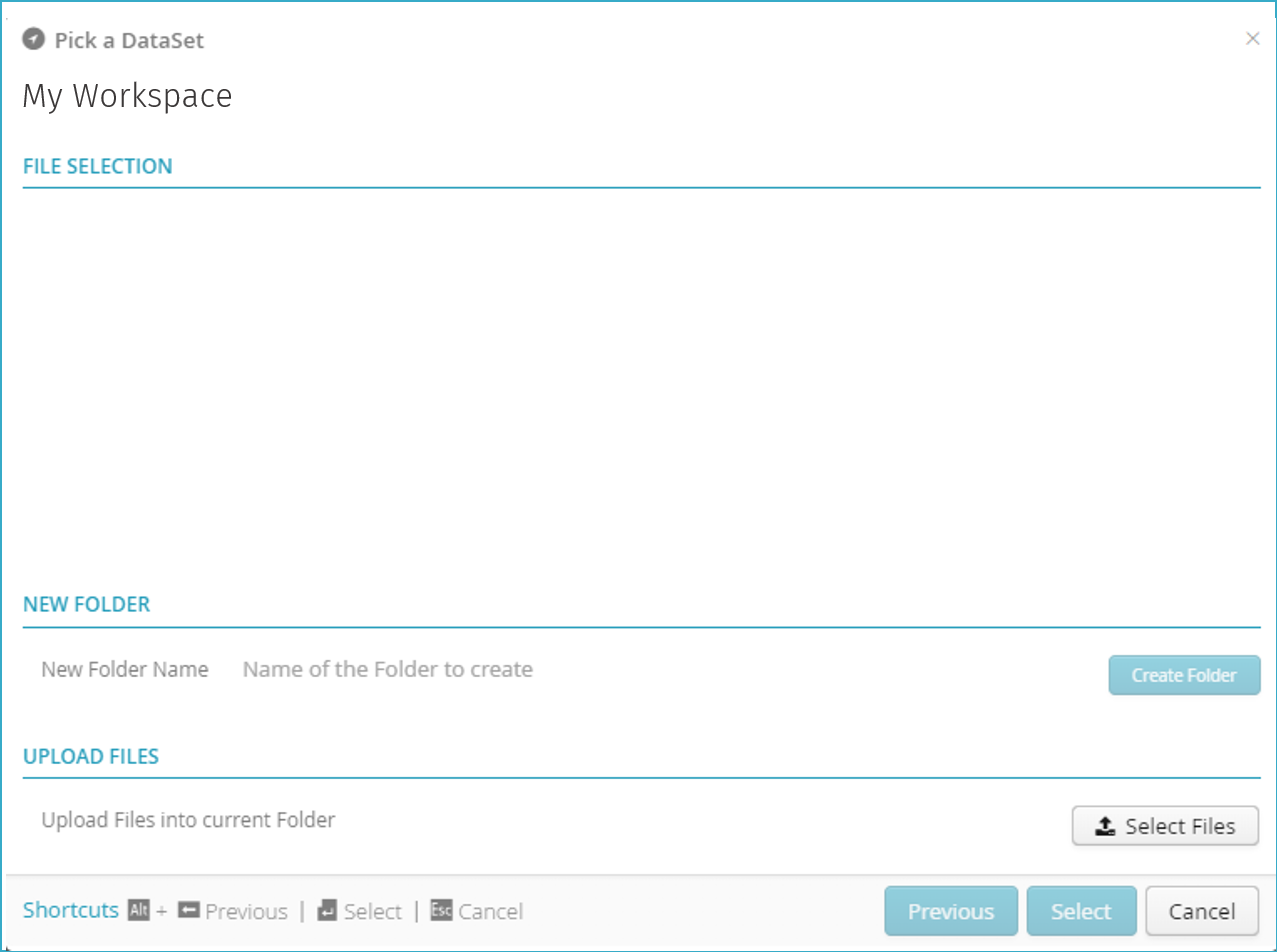
In “Upload Files”, click “Select Files”.

Import the demonstration file provided with the starter guide (My_Data.csv).
The file will now appear in “File Selection”.

Click “My_Data.csv” to select the file.
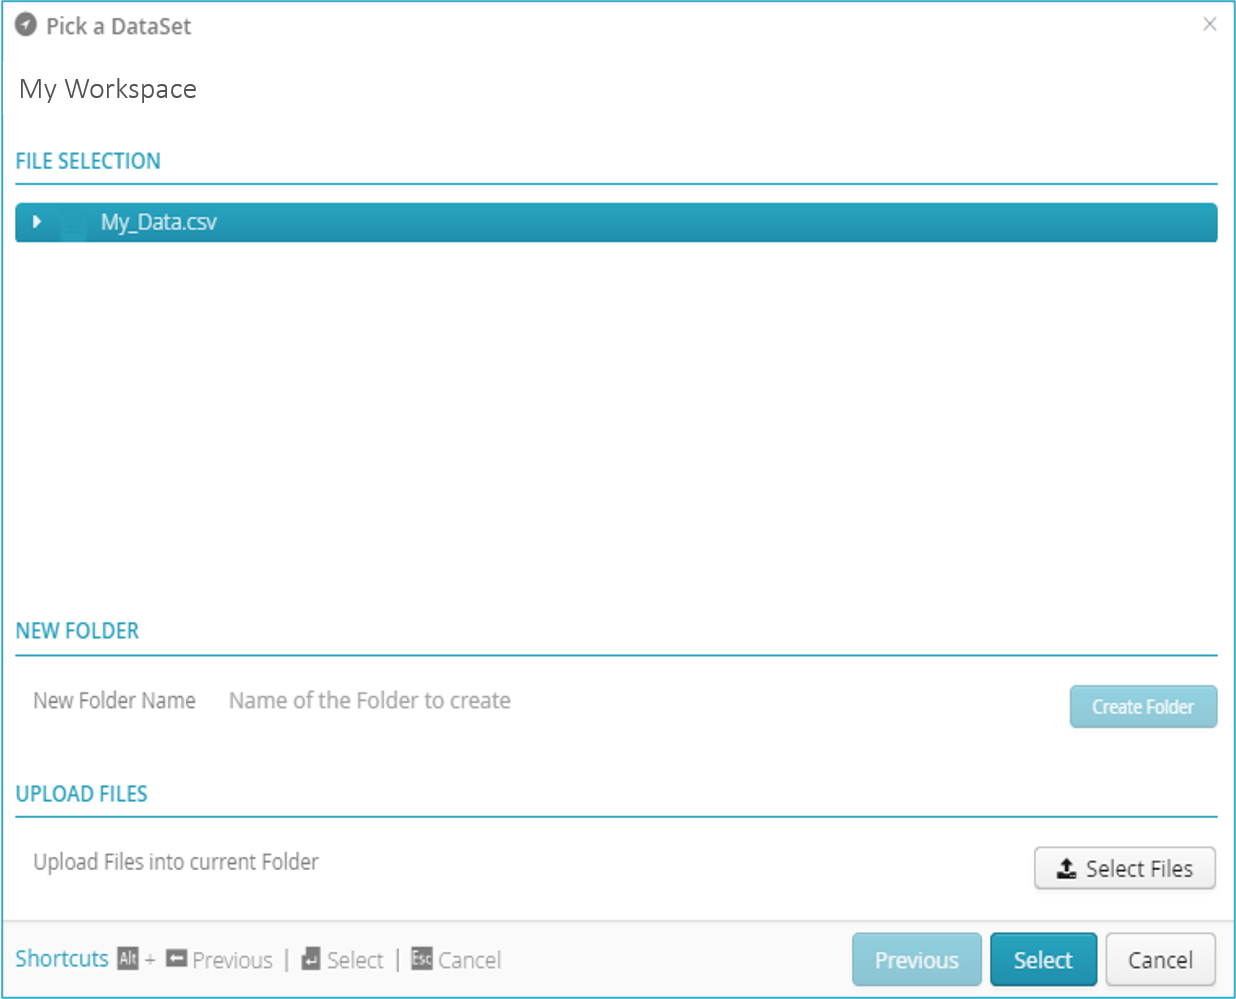
The Select button will light up to show it has been activated.
Click Select
The Flow Designer interface will reappear with your source node
 now configured.
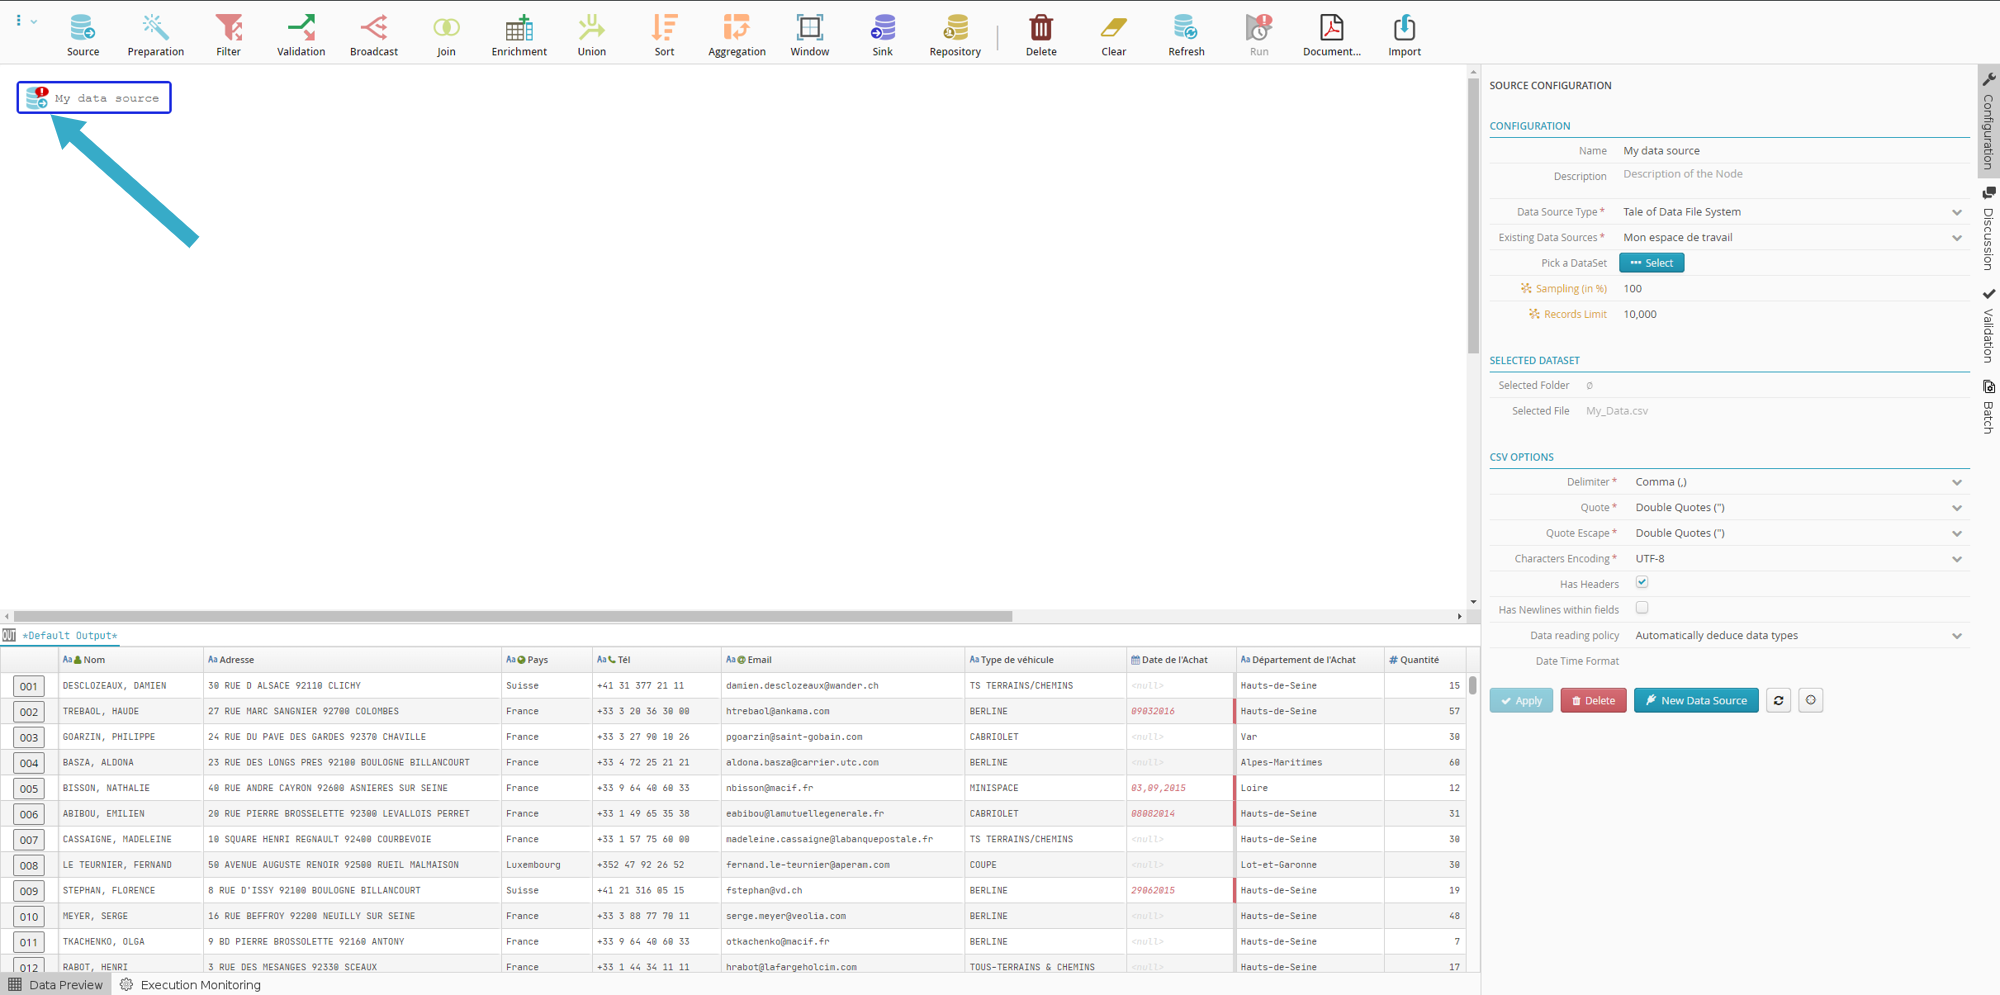
Note
The icon  will indicate that the source is not yet ready for use. It needs to be linked to a sink node
  .
.
Note
A preview of the data in the imported file will be displayed in the preview zone at the bottom of the screen.
Adding a data sink
Drag and drop the sink node icon  from the toolbar to the canvas beside the source node
  .
.
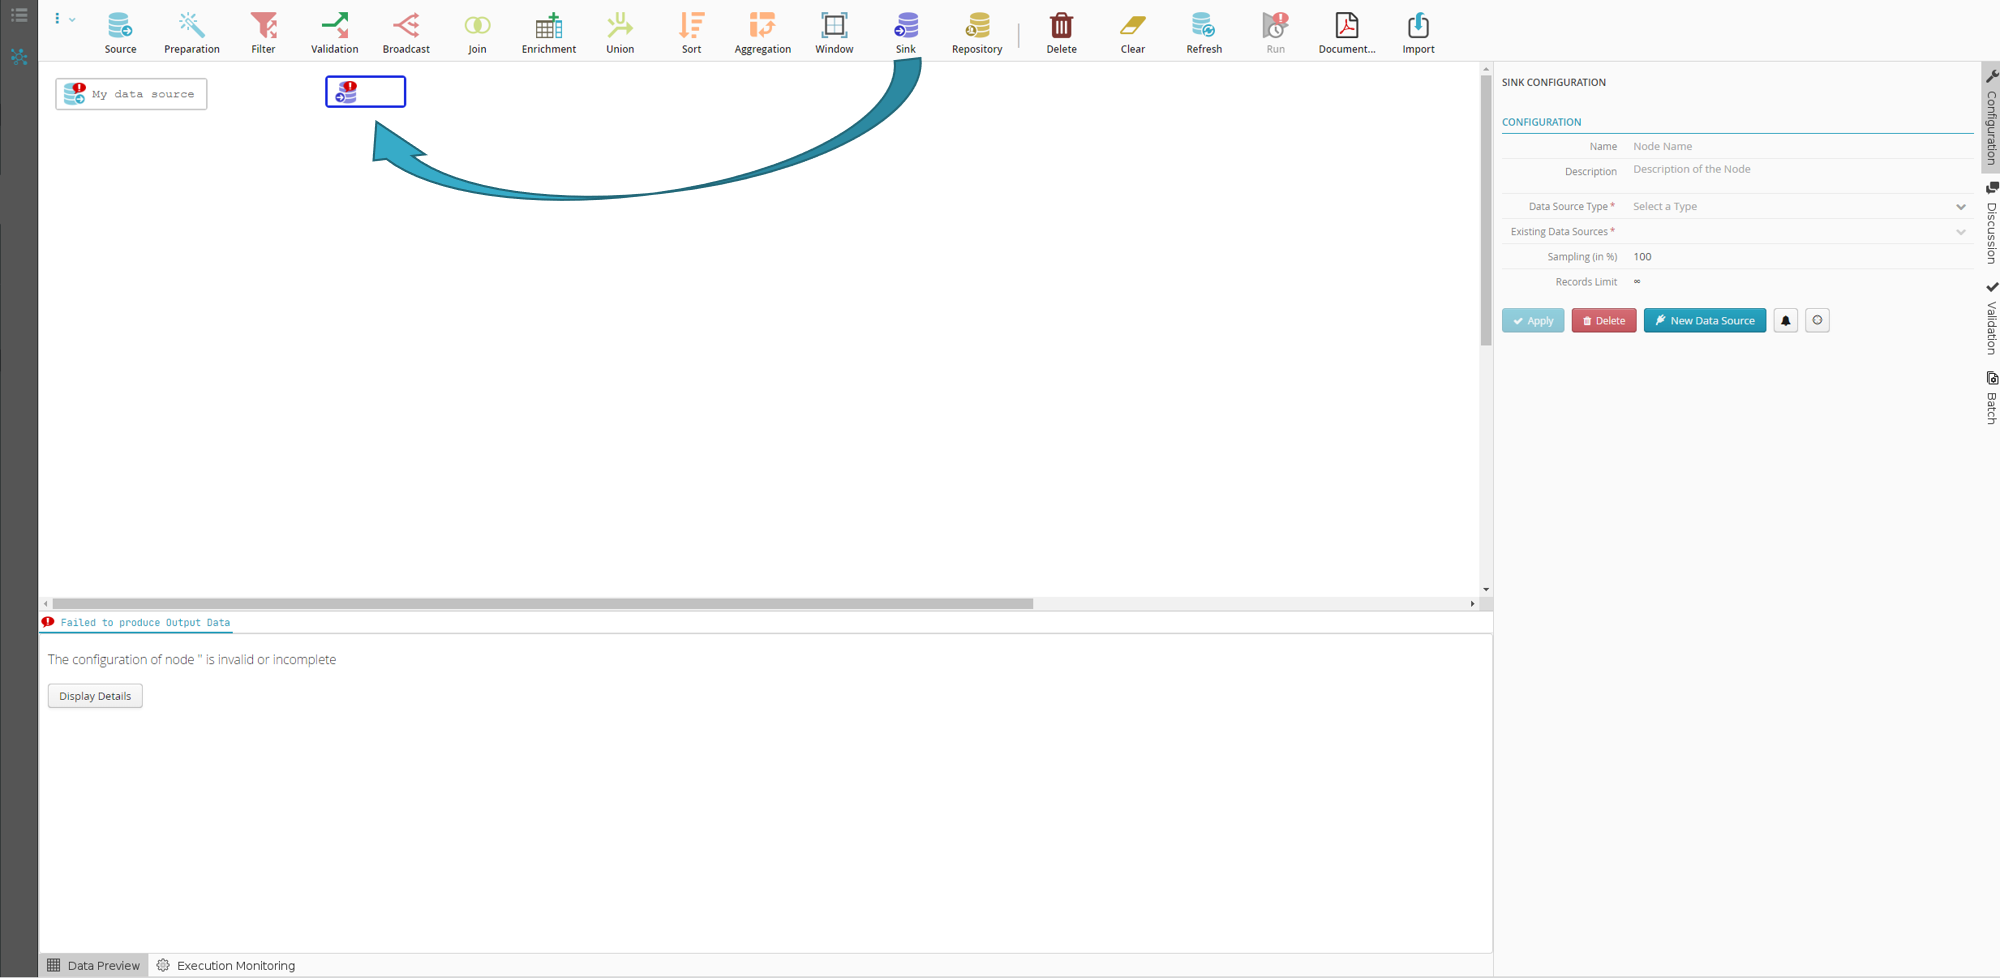
A sink node  lets you send records to a storage system.
Configuring the sink node
You may be able to name your sink node
 .
.For example: “Processed data”
If you do not do this, the node will automatically take the name of the selected file or table.
In “Type of Data Source”, select Tale of Data file system.
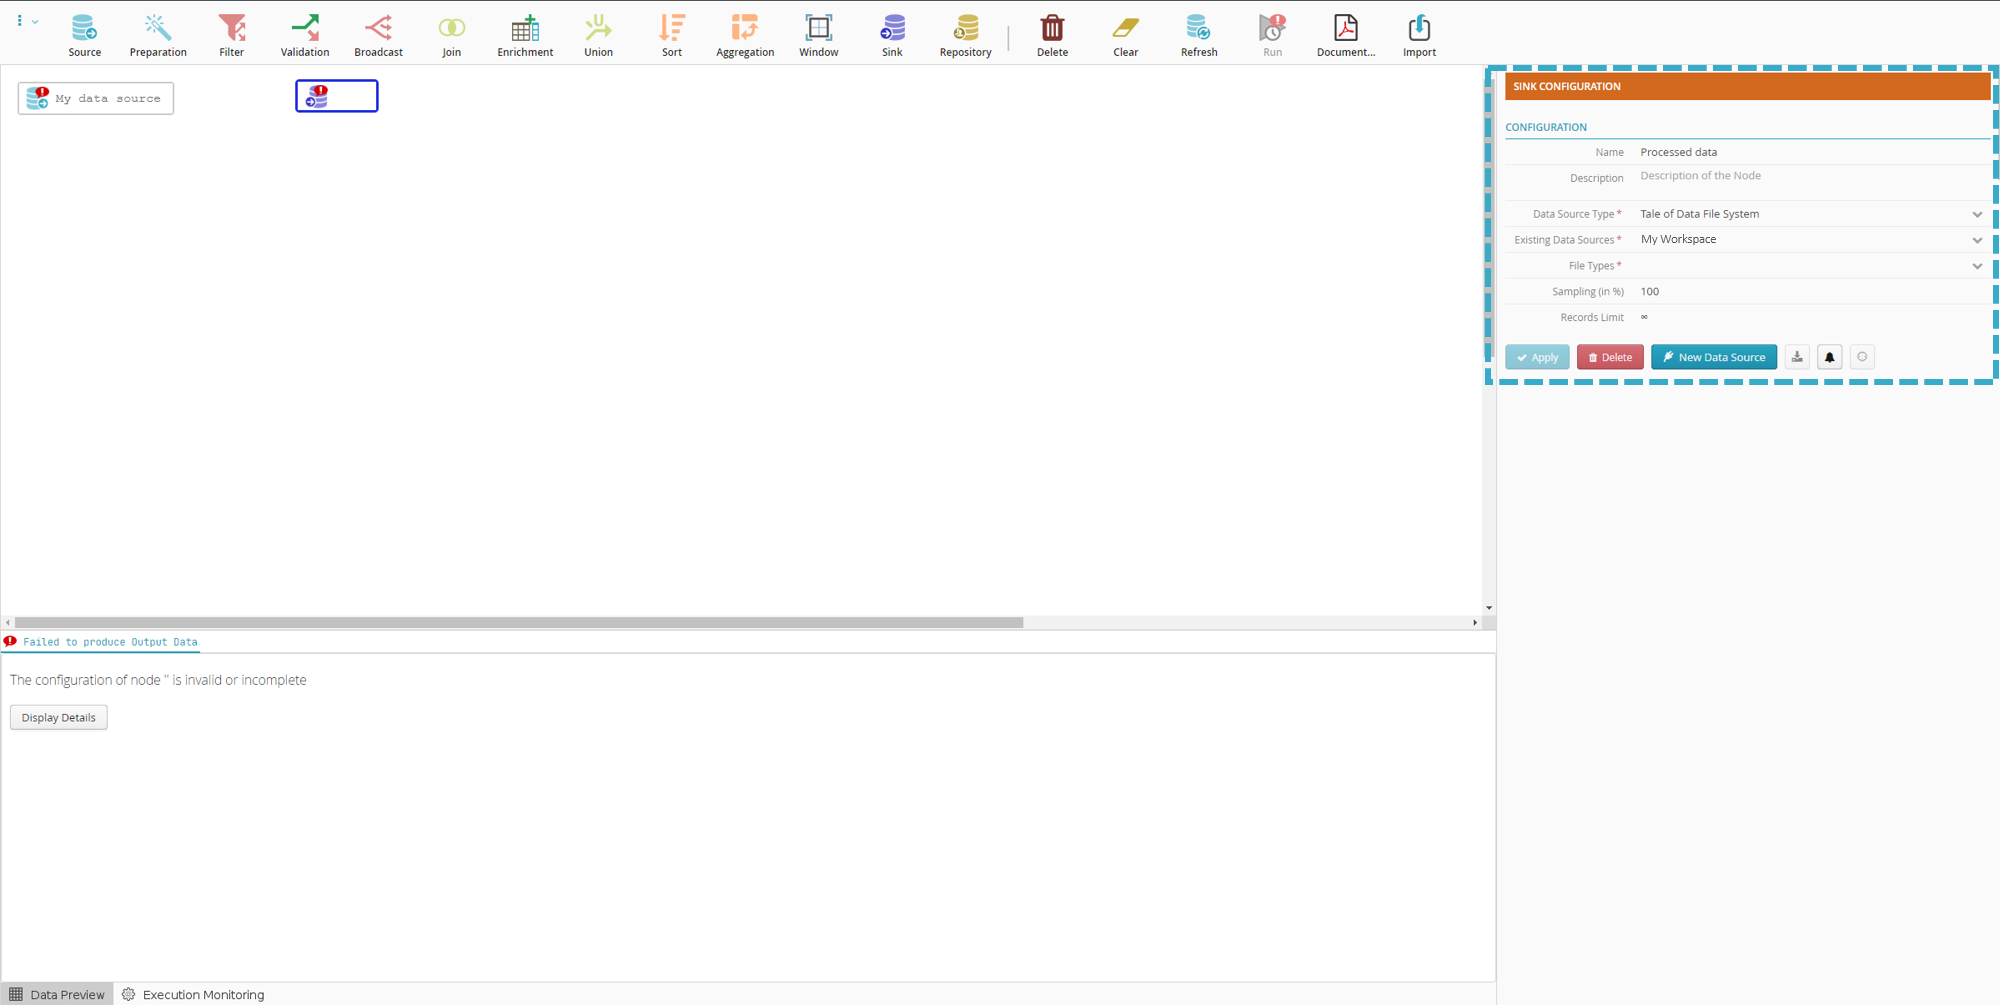
Note
The Existing Data Sources field auto completes.
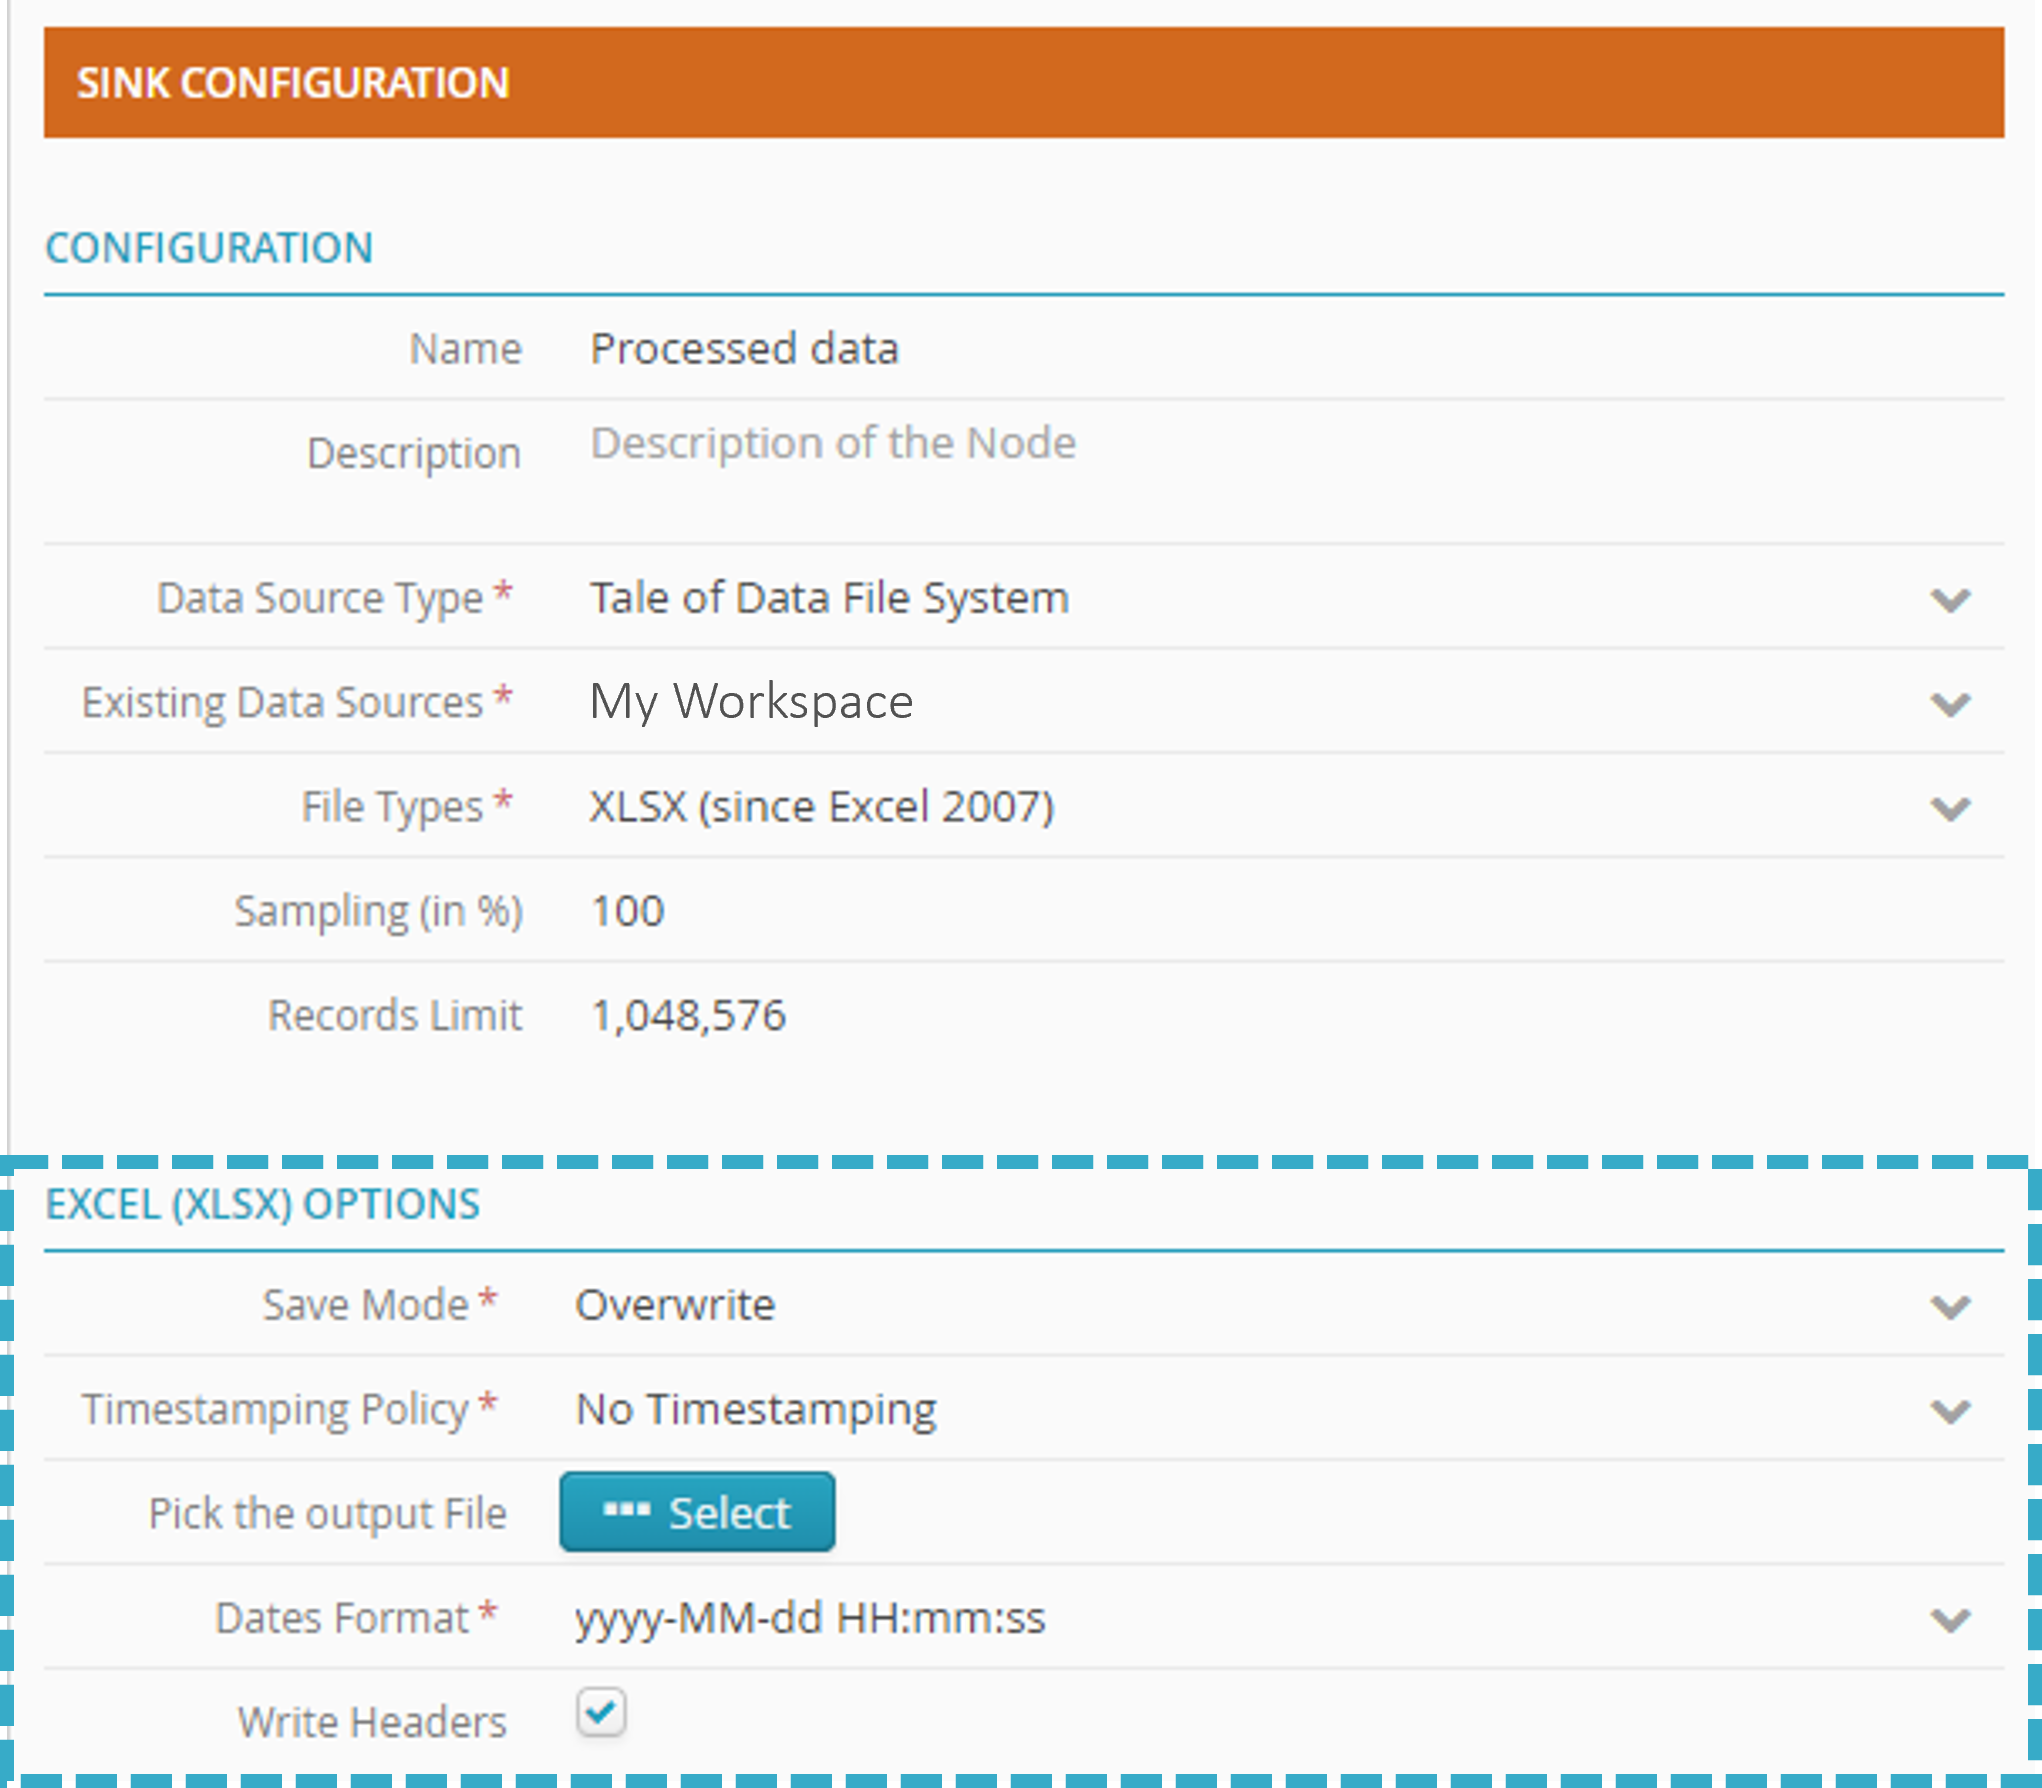
From the drop-down list in “File Types”, select “XLSX (in Excel 2007)”.
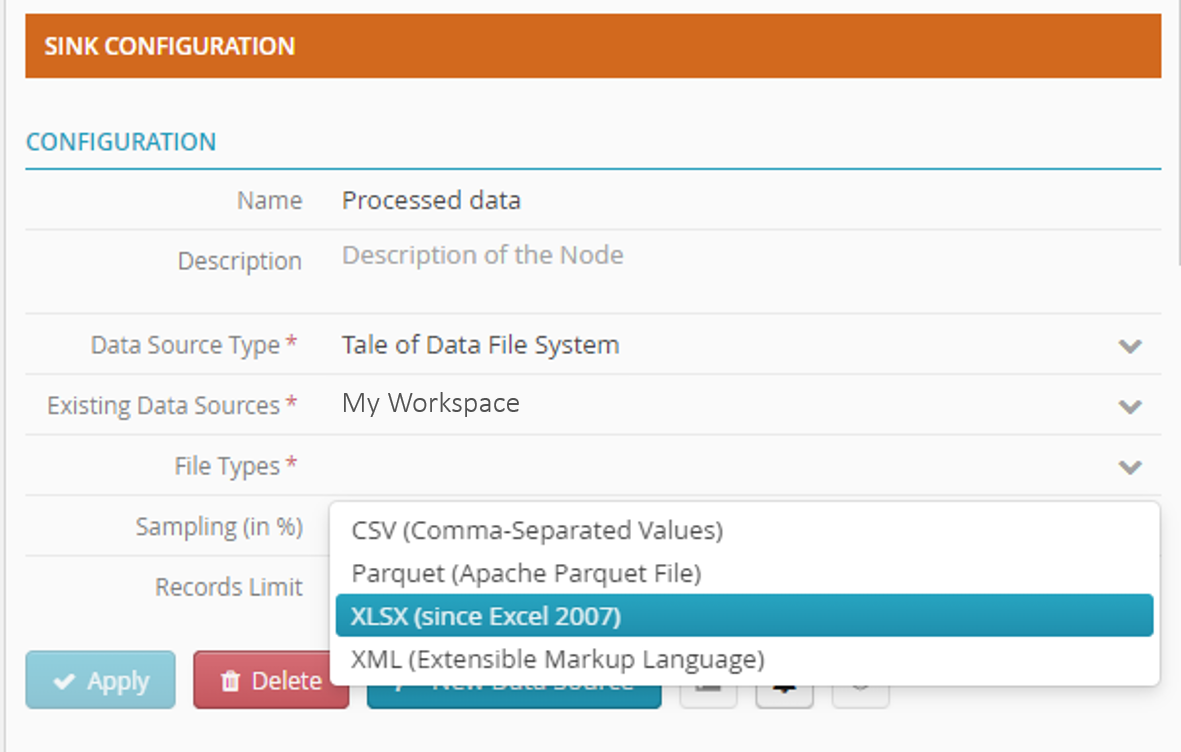
Important
An orange bar means that you must click Apply to save the node configuration
You will lose the node configuration if you do not click Apply.
A new area will appear in the configuration zone.
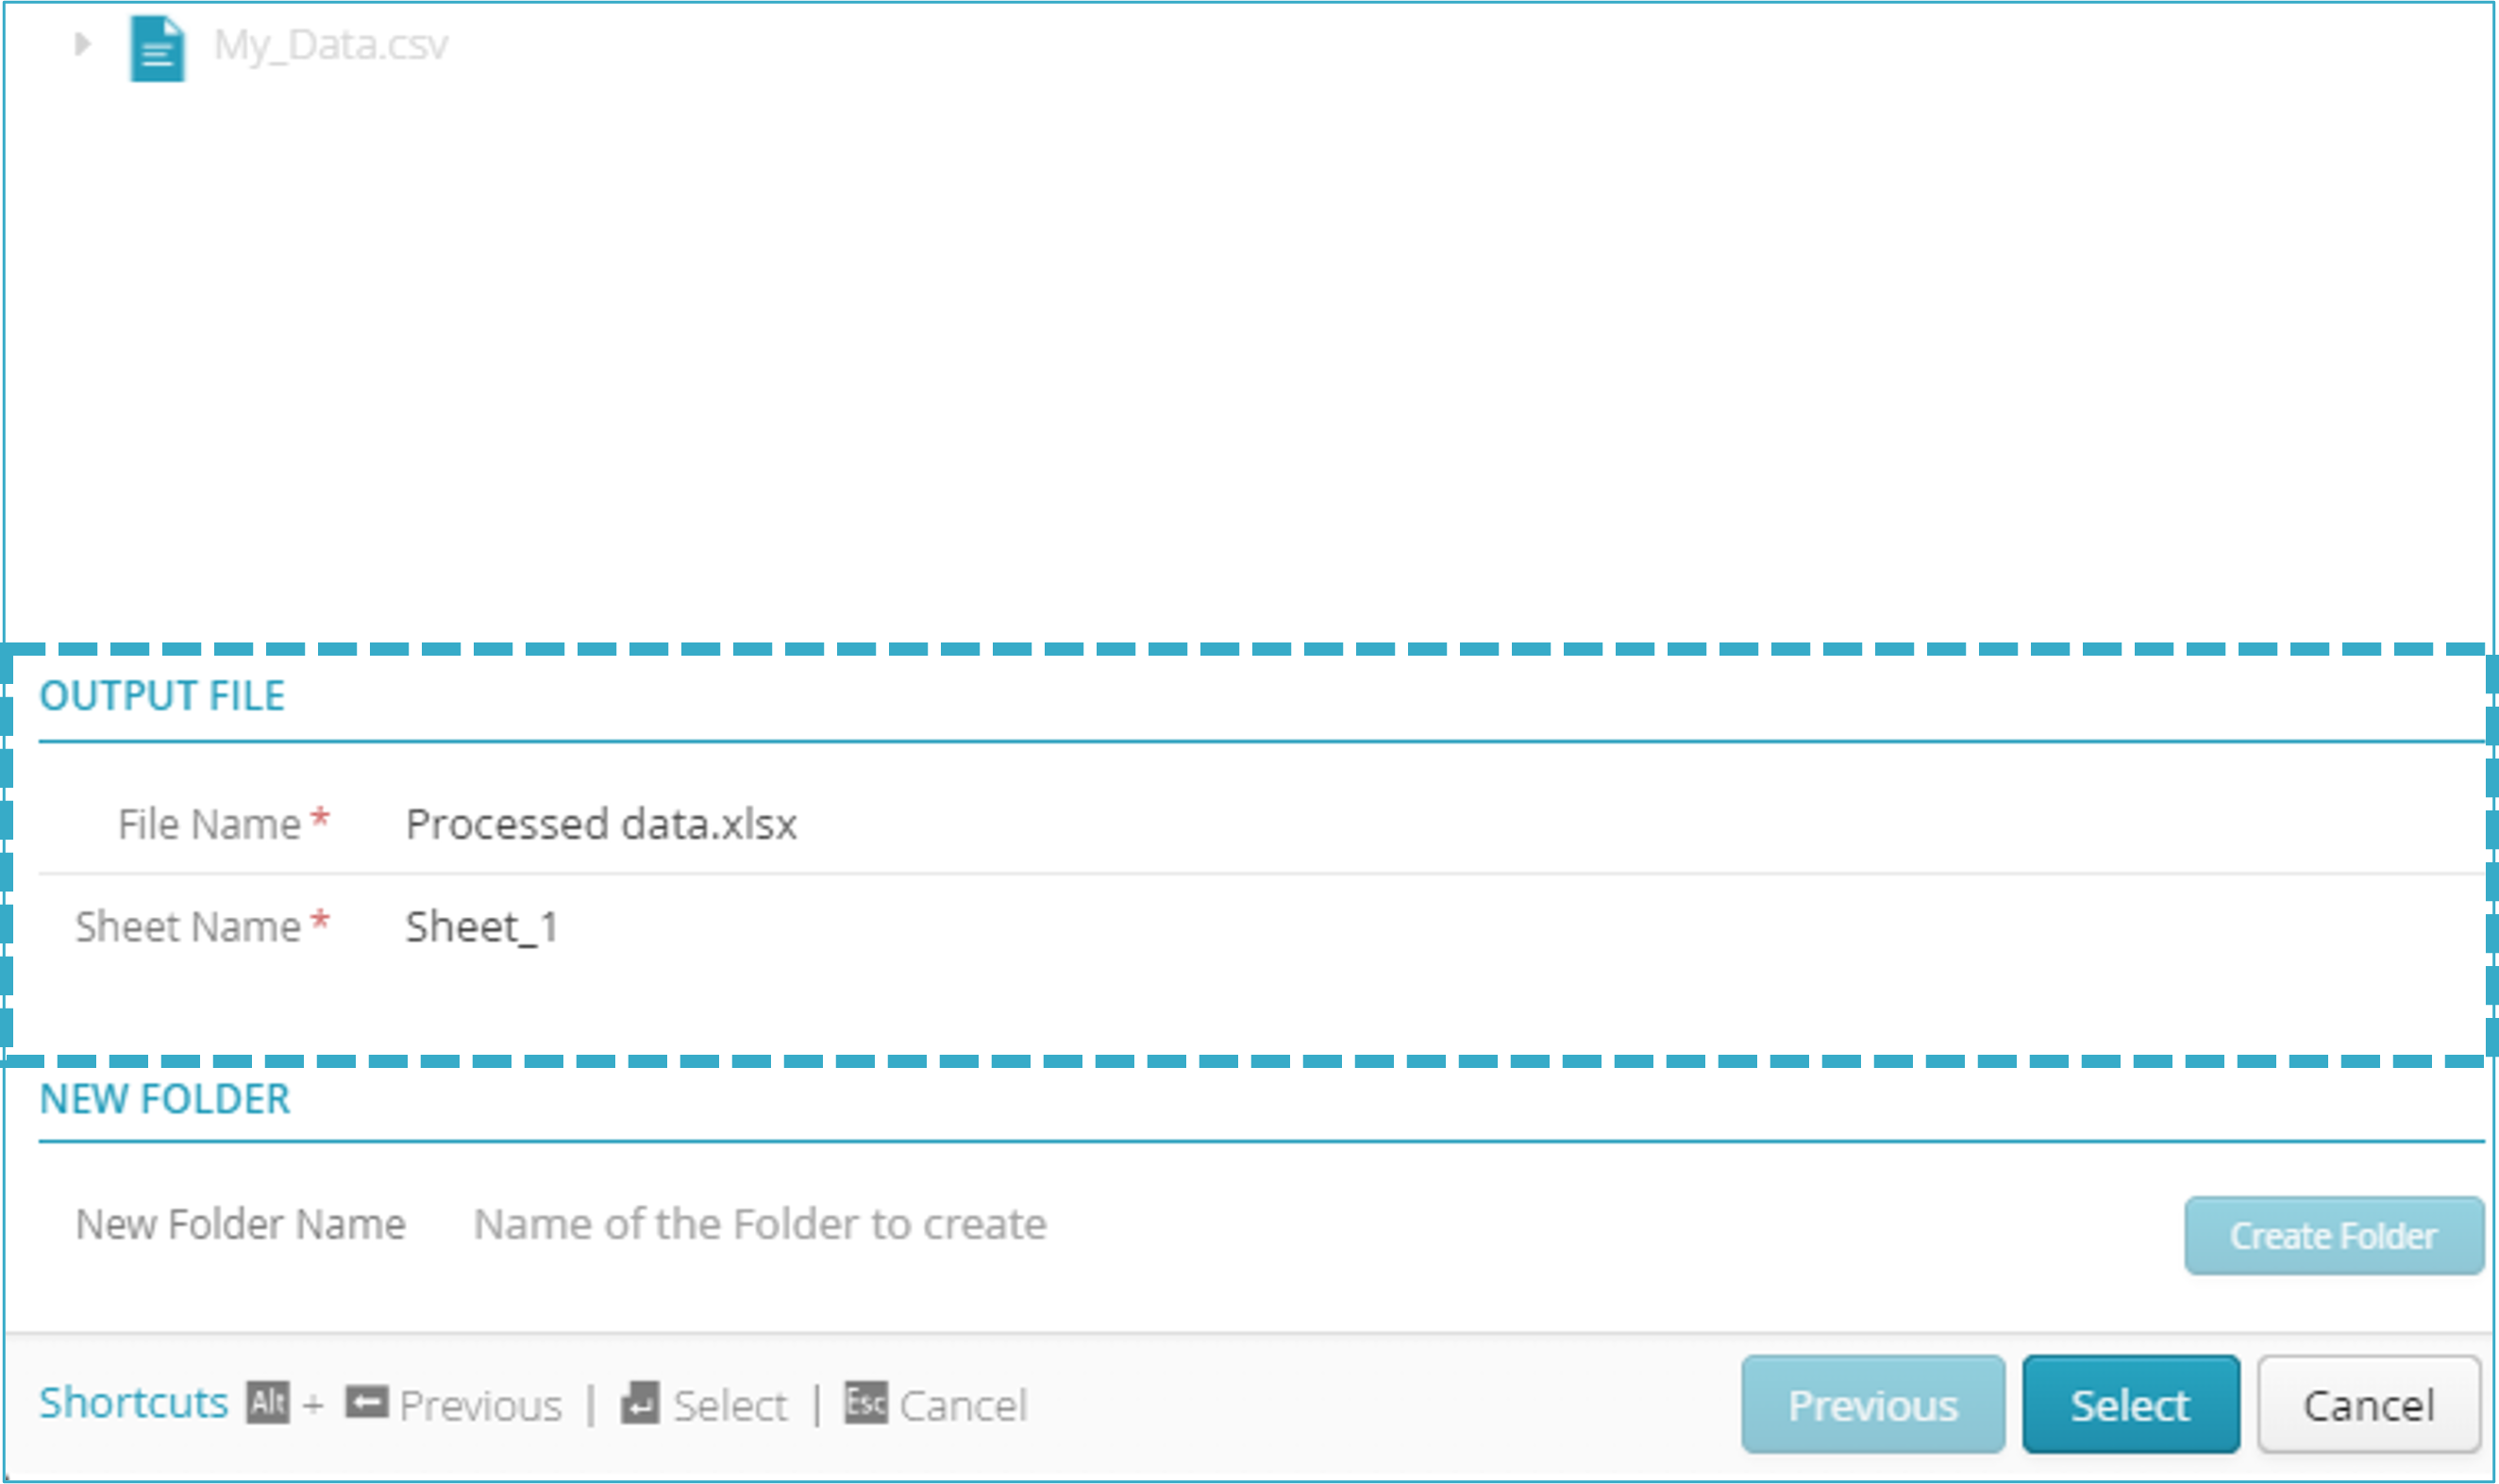
In Excel (XLSX) Options, click Select.
A new window will open
In Output File, complete the following two fields:
- File Name: the name to be given to the Excel file,
For example: “Processed data”
- “Sheet name”, name of the spreadsheet in which the data will be stored.
For example, “Sheet_1”
Important
To activate Select, exit the data entry field.
When you have completed and exited the Sheet Name field, the button will activate and light up.
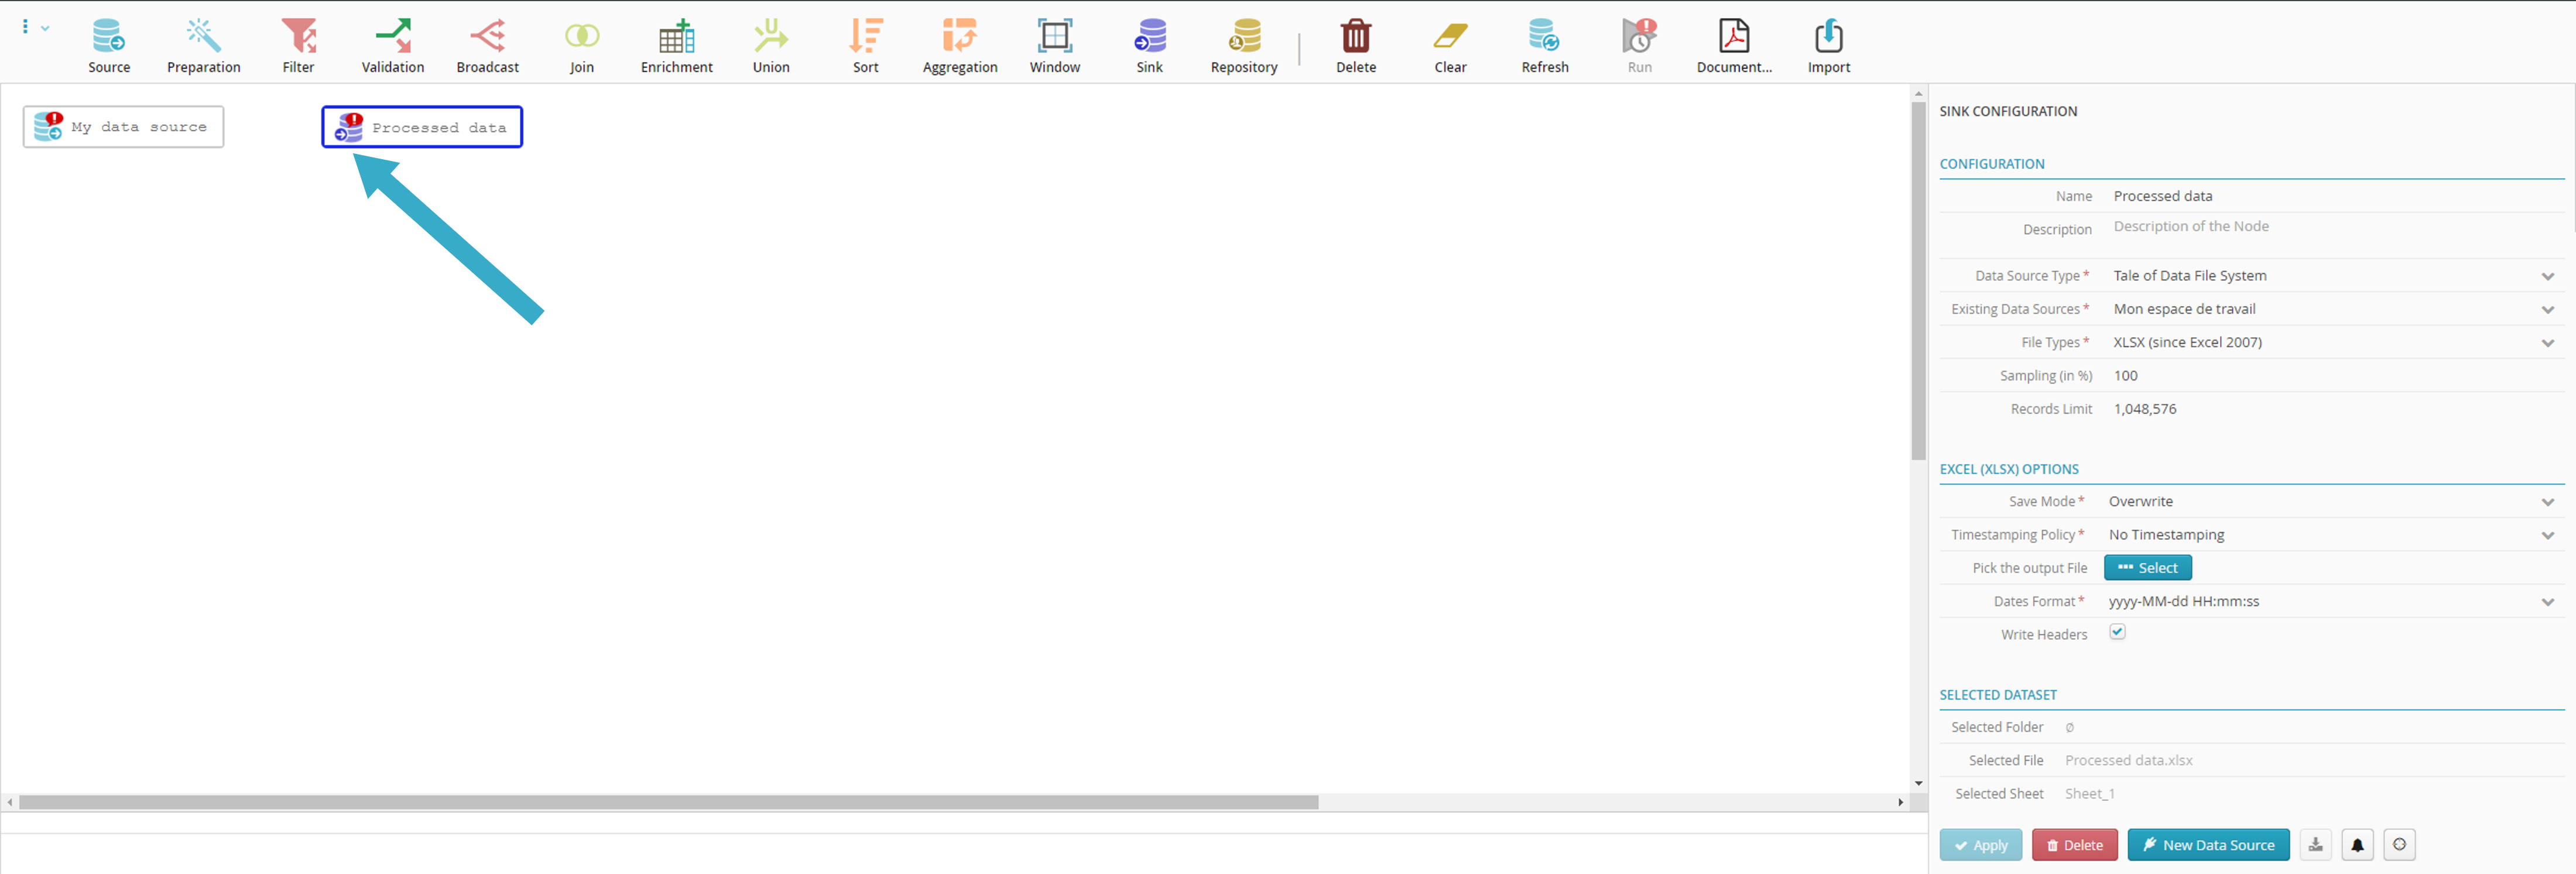
Click Select
Flow Designer will reappear with your configured sink node
 .
.
Save mode
- Overwrite
to overwrite the table or file whenever the flow is run.
- Append
to add records to the end of an existing table or file.
- Create
to create a new table or file. An error will be flagged if the table (or file) already exists.
Note
Other modes may exist, depending on the type of connector used. The three modes listed here are common to almost all Tale of Data connectors and are the most commonly used.
Linking nodes
To link two items in the flow:
Drag the mouse to the sink node
 , holding the left mouse button down.
Release the left mouse button when you are over the sink node
 .
.
You have now created a link between two nodes.
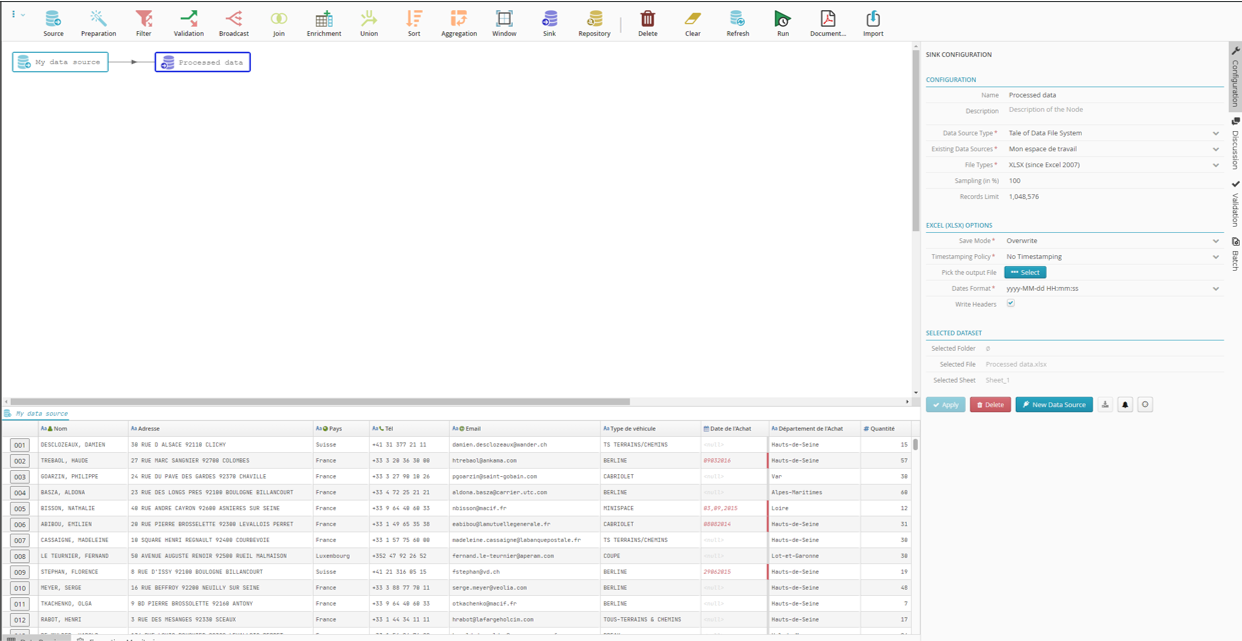
Note
The tooltip with the exclamation mark has disappeared: the link is now valid and the nodes are ready for use.
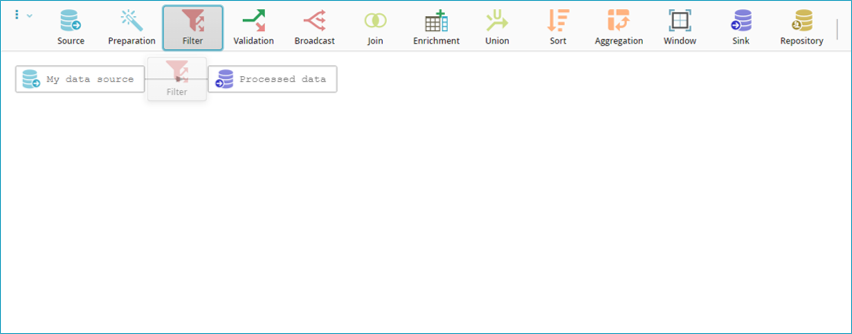
Adding a filter node
We want to filter the rows from the input file and only keep those lines that have France in the Country column. To do this, we are going to add a filter node  to our flow to act as the intermediary between input and output data.
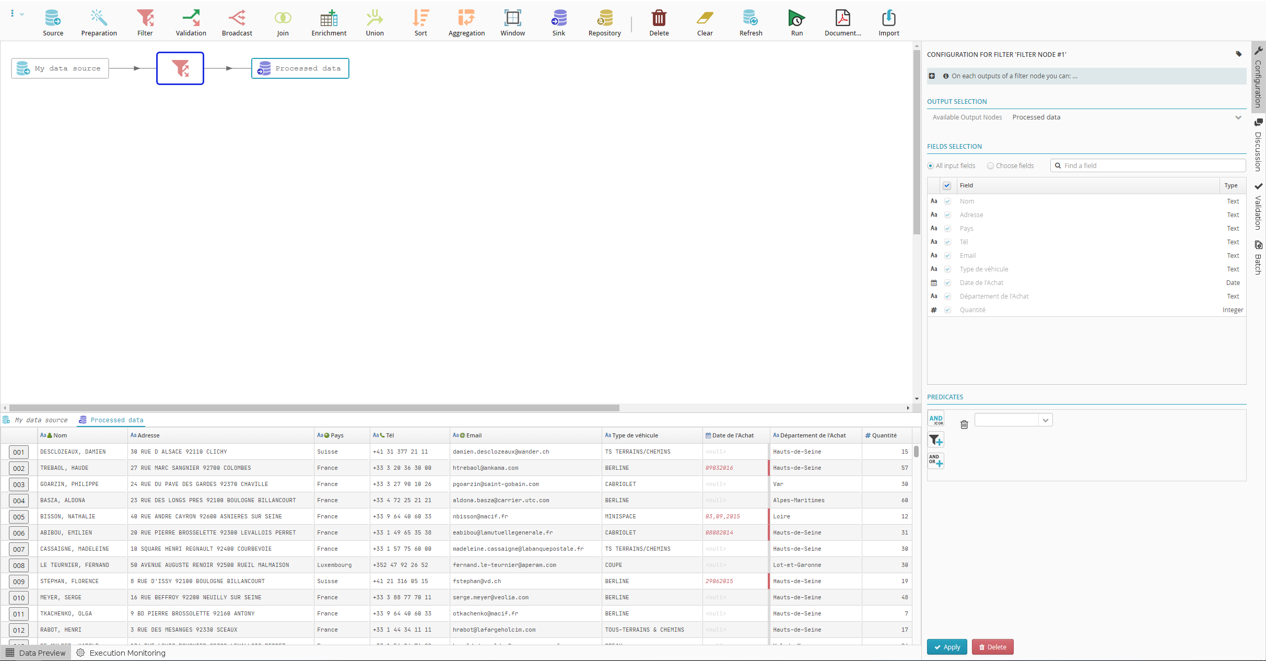
Configuring the filter node
In “Predicates”, click on the arrow to access the drop-down list.
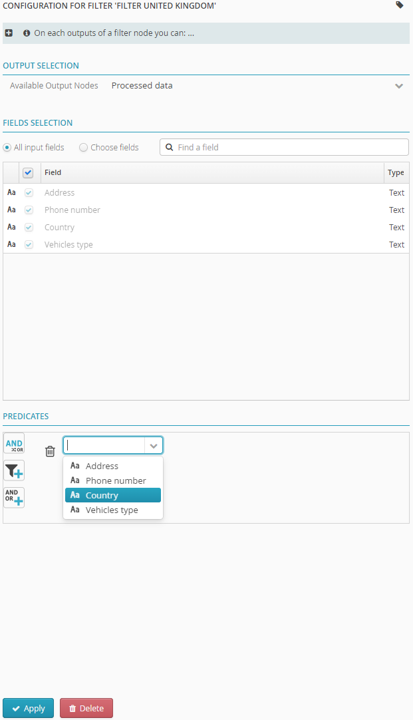
The content of the drop-down list depends on which file was uploaded..
Select Country. Two new fields will appear.

In the blank field, enter France. By adding the condition “equal to”, the filter will be sensitive to the (upper/lower) case of the input value.
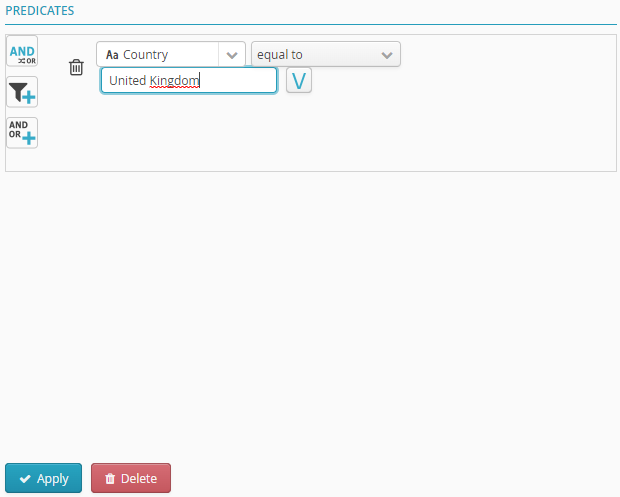
Click Apply.
A preview of the filtered data will display in the data preview zone at the bottom of the screen.
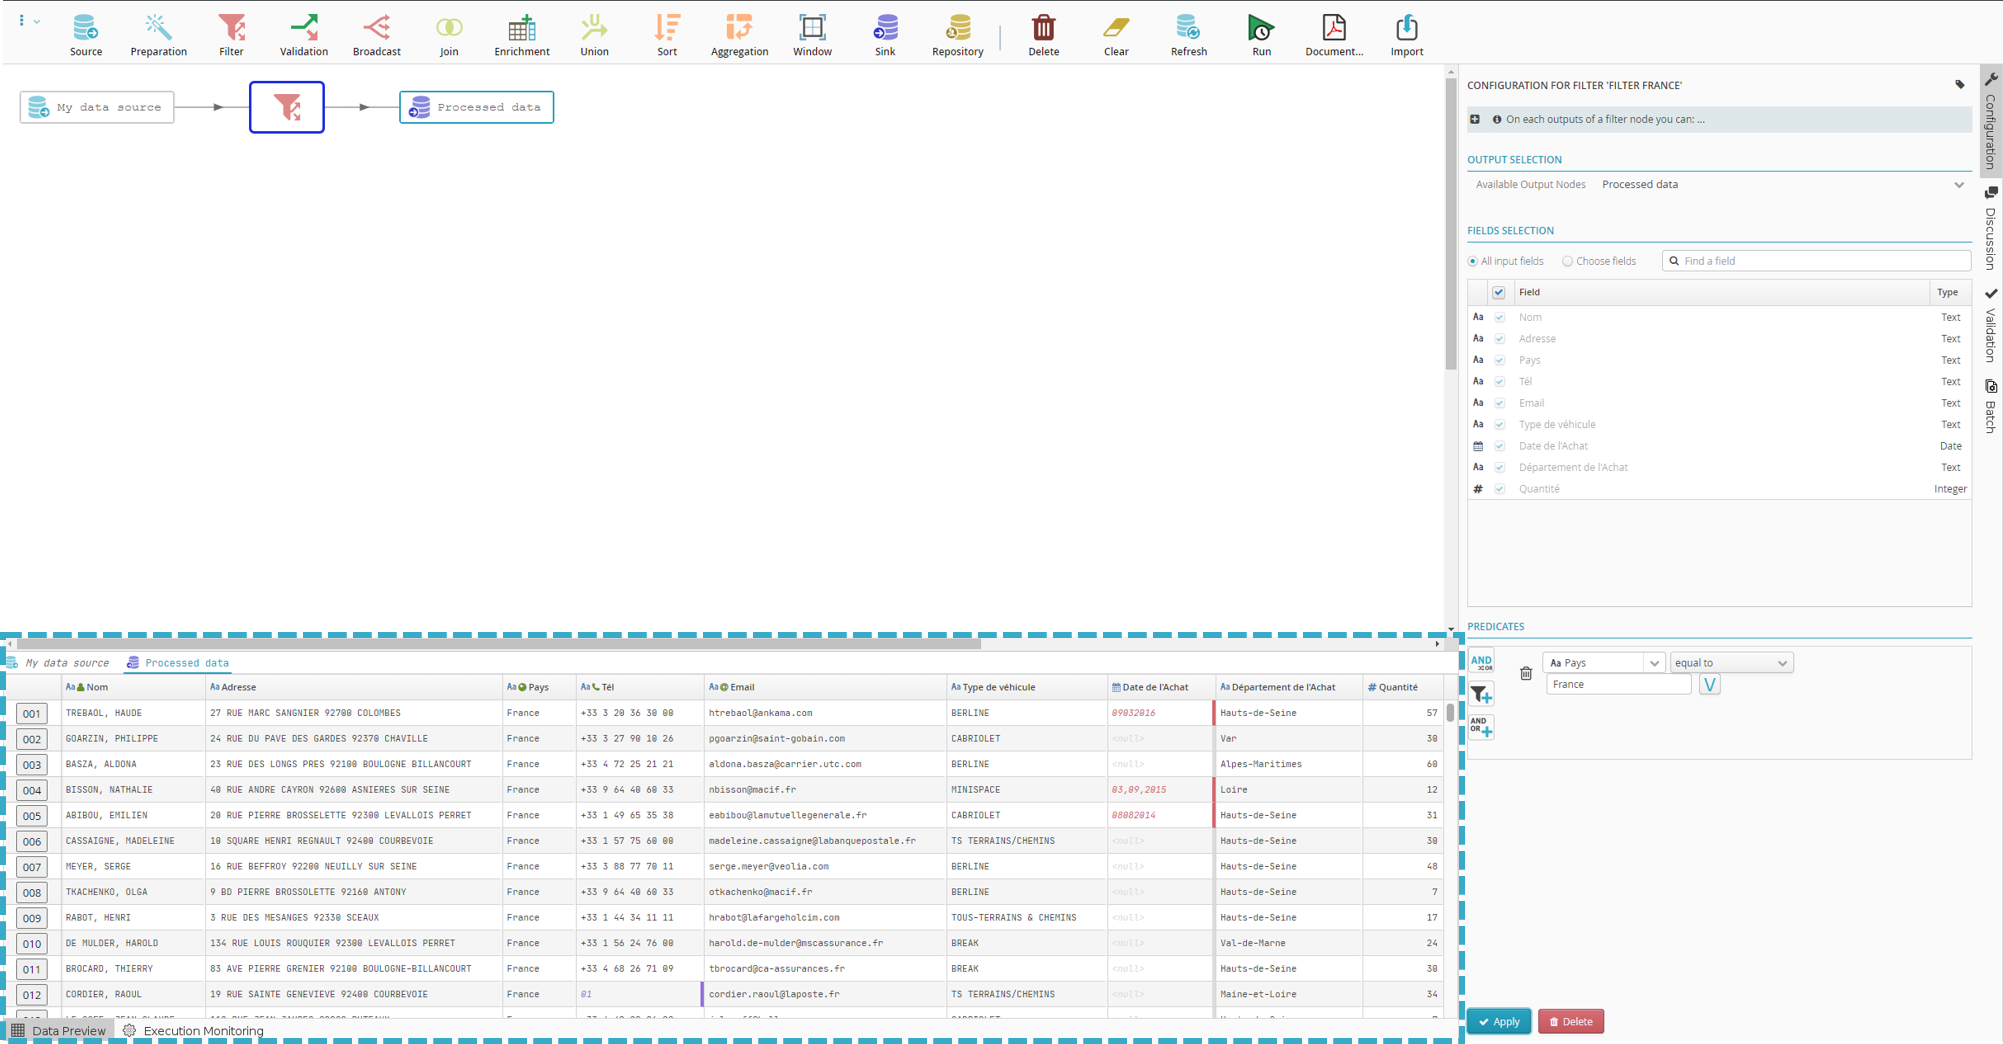
Note
When clicked, the sink node  will appear to show all the results but in fact will show only a sample of them.
The flow must be run to ensure the entire dataset has been filtered.
Hint
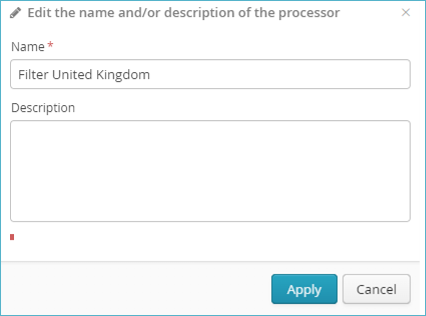
You can name the filter in the Name field.
This helps document the flow. If you choose a particular name, this will appear in the PDF flow documents when they are produced (clearly detailing how the flow works).
Running the Flow
We will run the flow to obtain its results.
Click Run on the right of the toolbar.

The scheduling window will open
Click Run Now
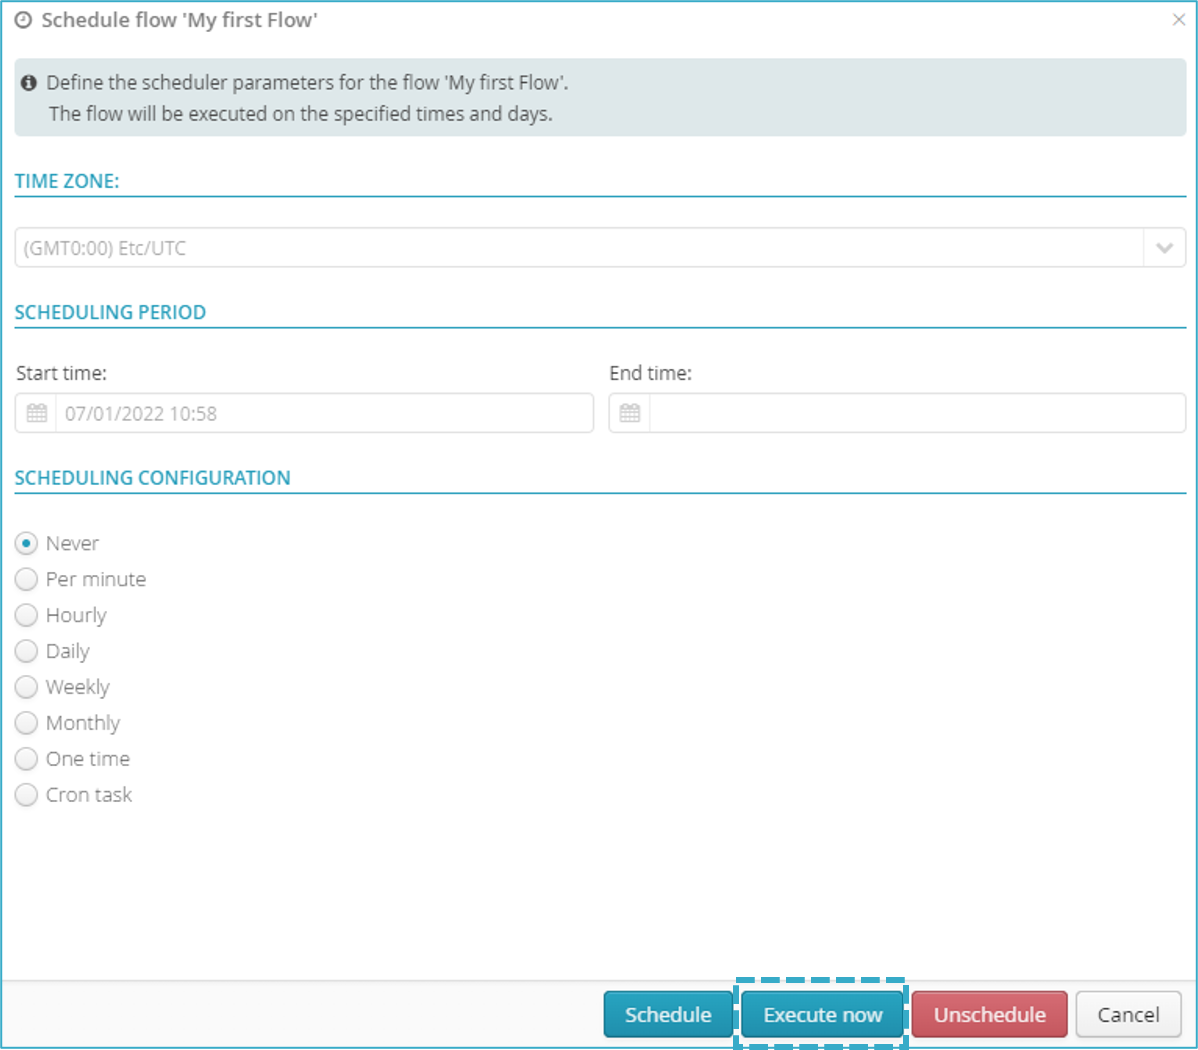
A message will appear that the flow has been successfully planned
 and run.
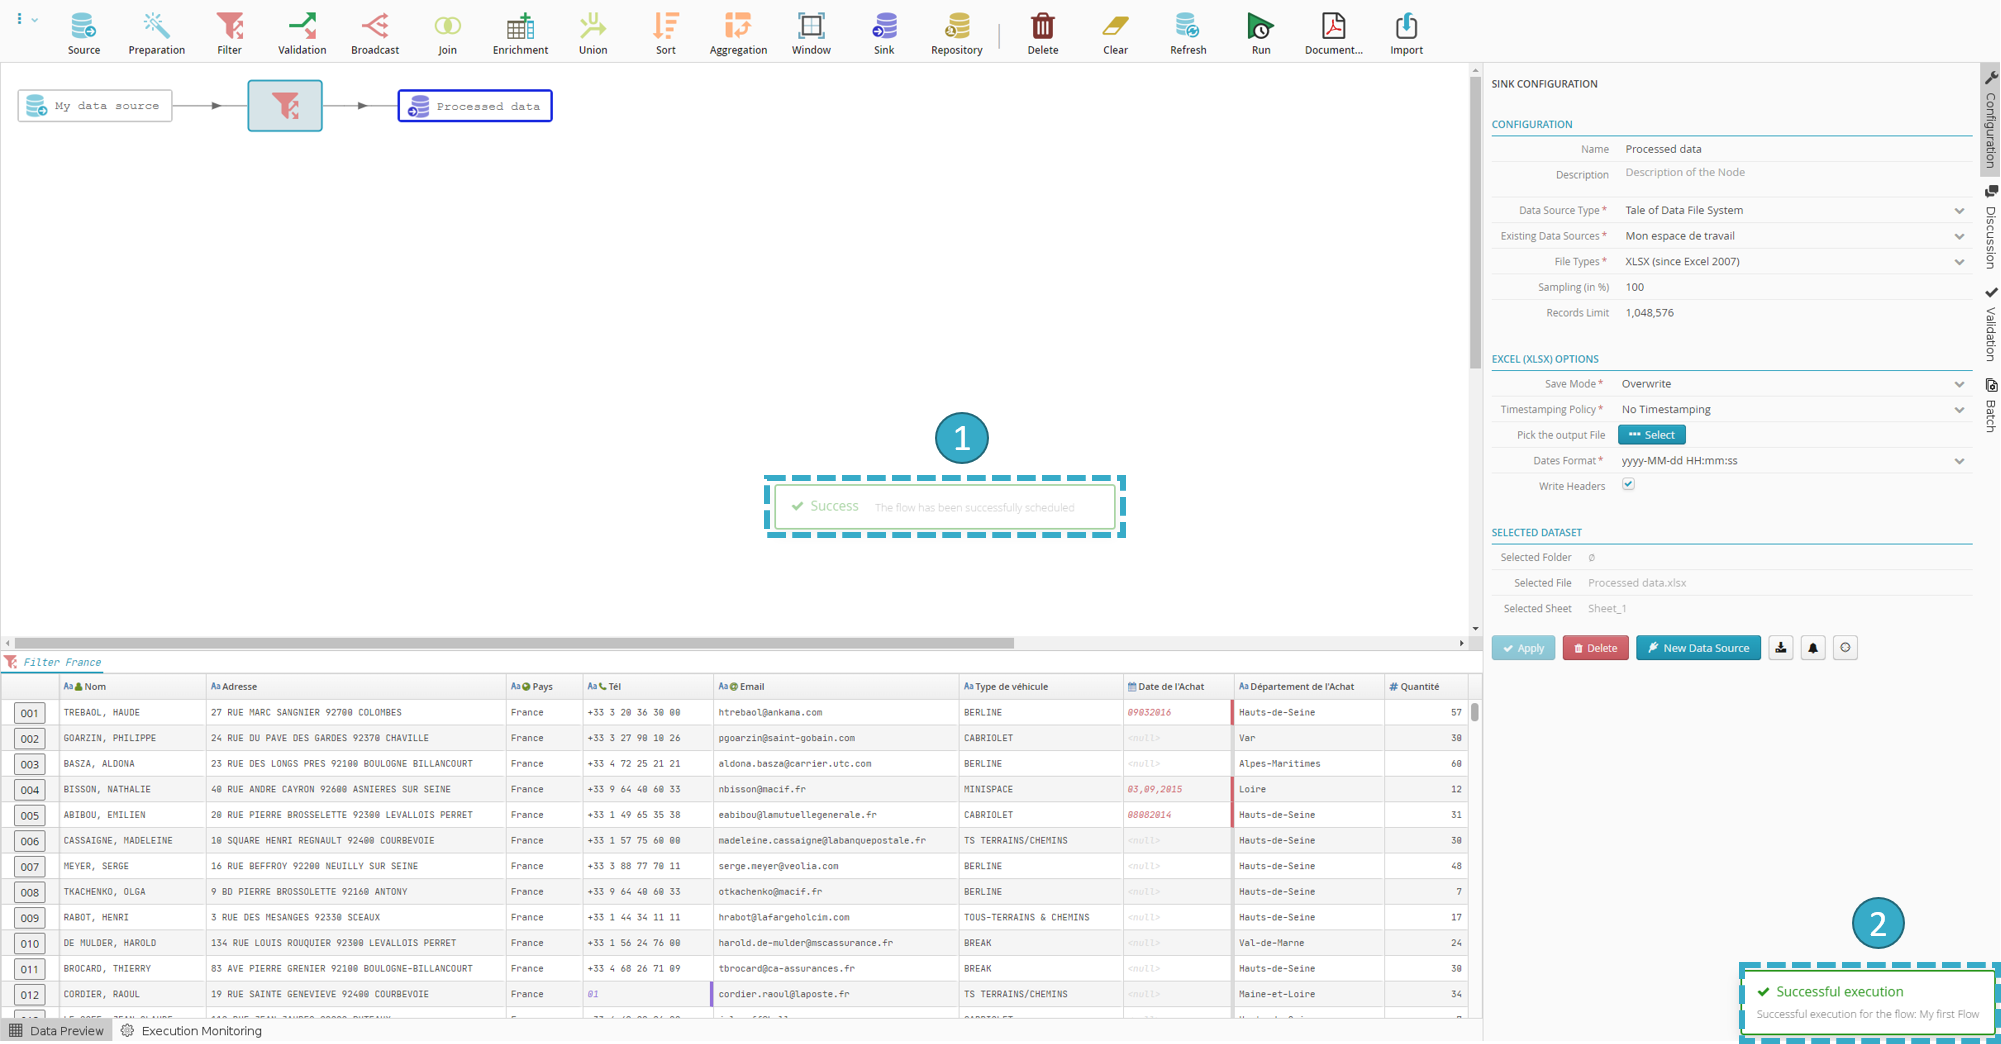
Congratulations on creating and running your first flow!
Downloading results
We now want to retrieve the flow results.
Compare the files before and after processing
You can compare the source and sink files.
- My_Data source file
- “My processed data” sink file
Note
This first flow is just an introductory example. Far more complex (but easy to use) processes are also available.
For example, you can:
Run the same process on other data without having to recreate the flow (= reusing flows),
Schedule (daily, weekly, etc.) runs
Process huge amounts of data (billions of rows)
Launch configurable notifications for all types of anomalies in the data.
Moving on
Managing your flows
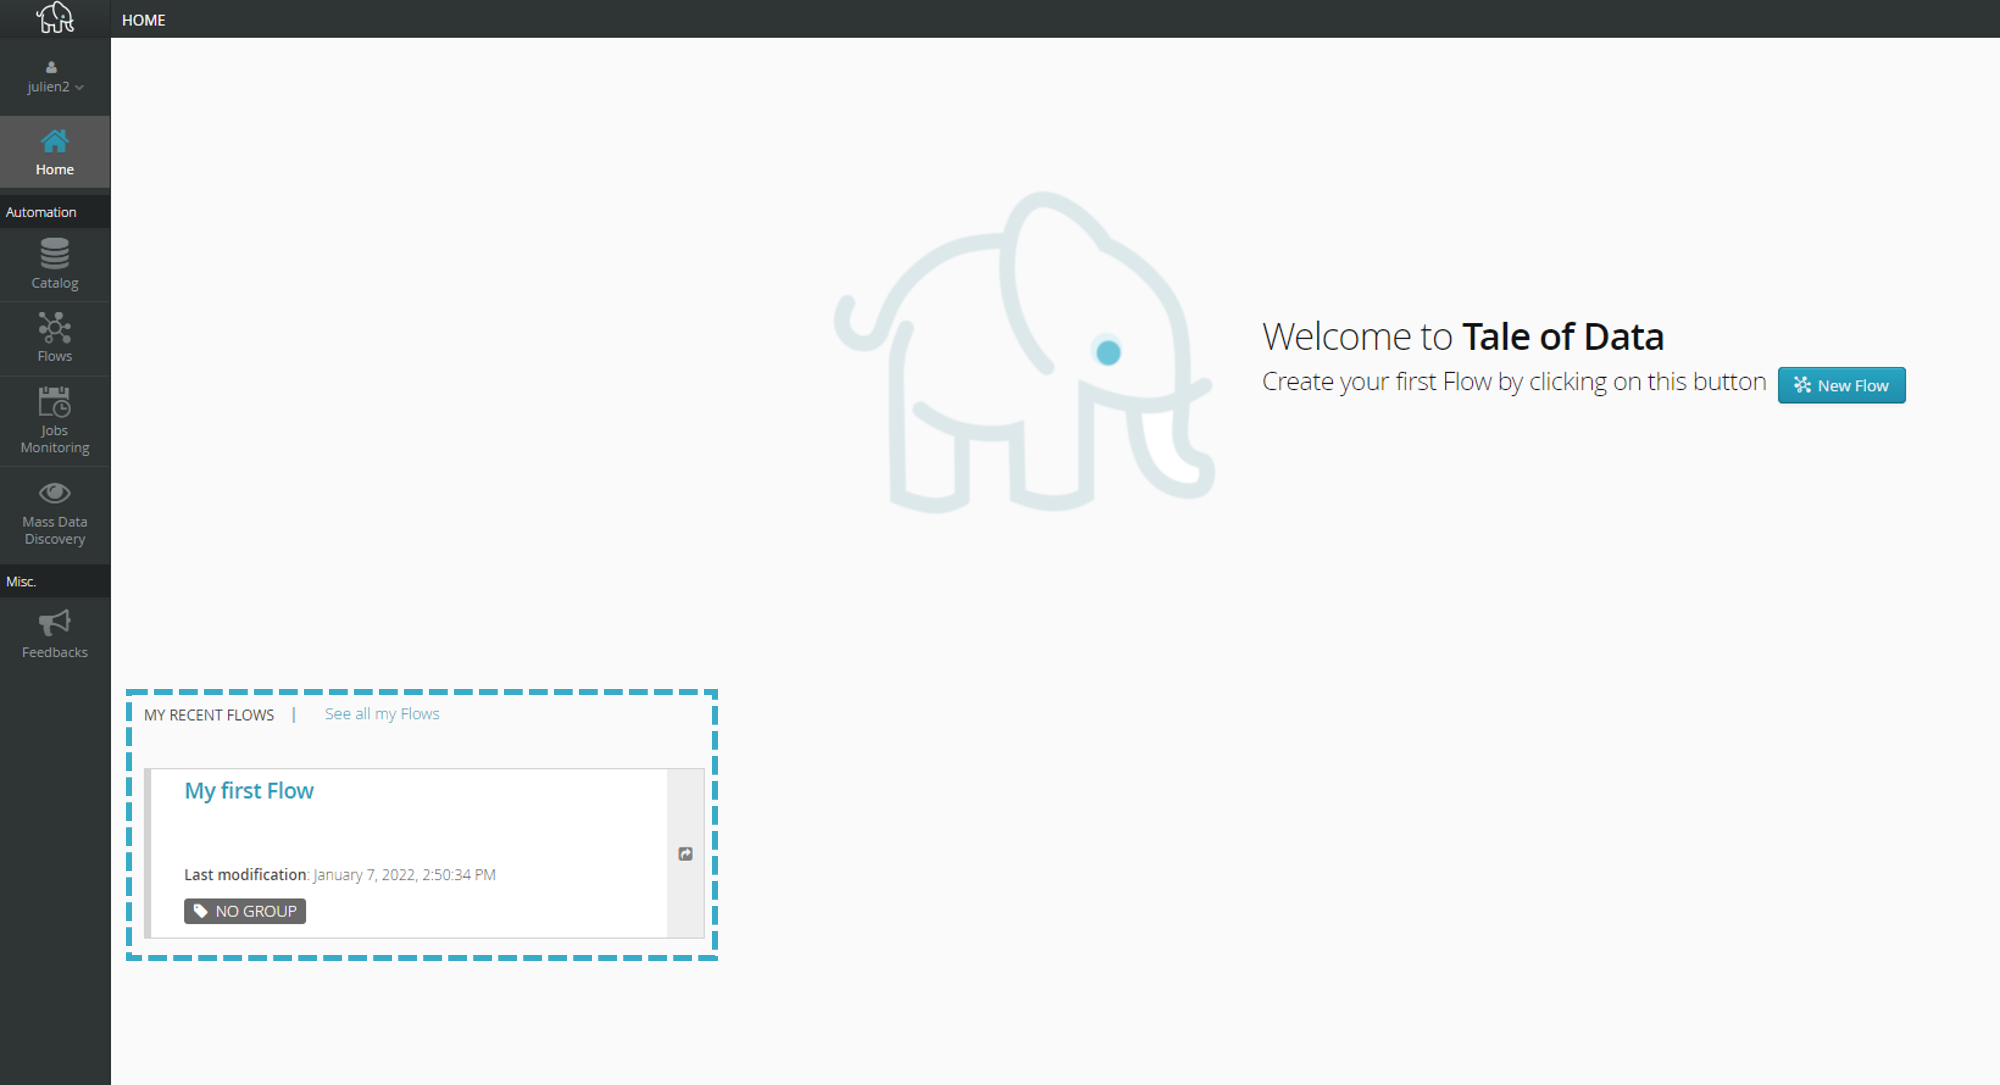
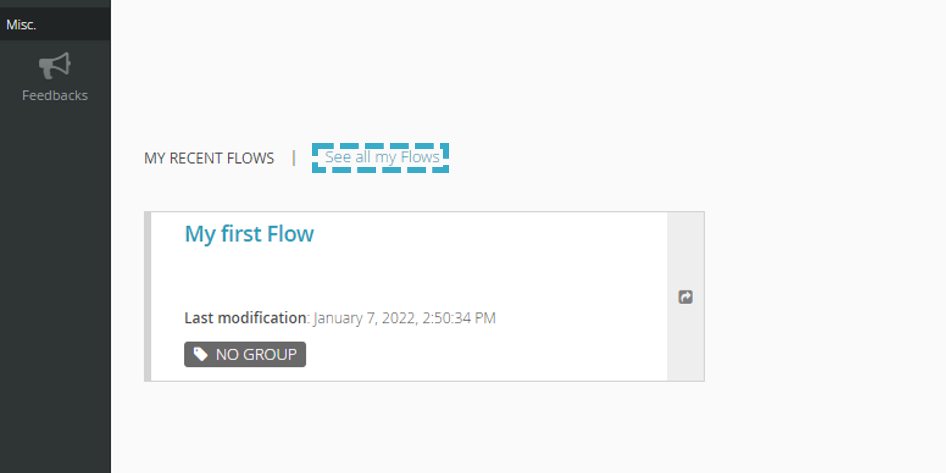
You can now see your flow in the My Recent Flows section of the home page.
Click See all my Flows
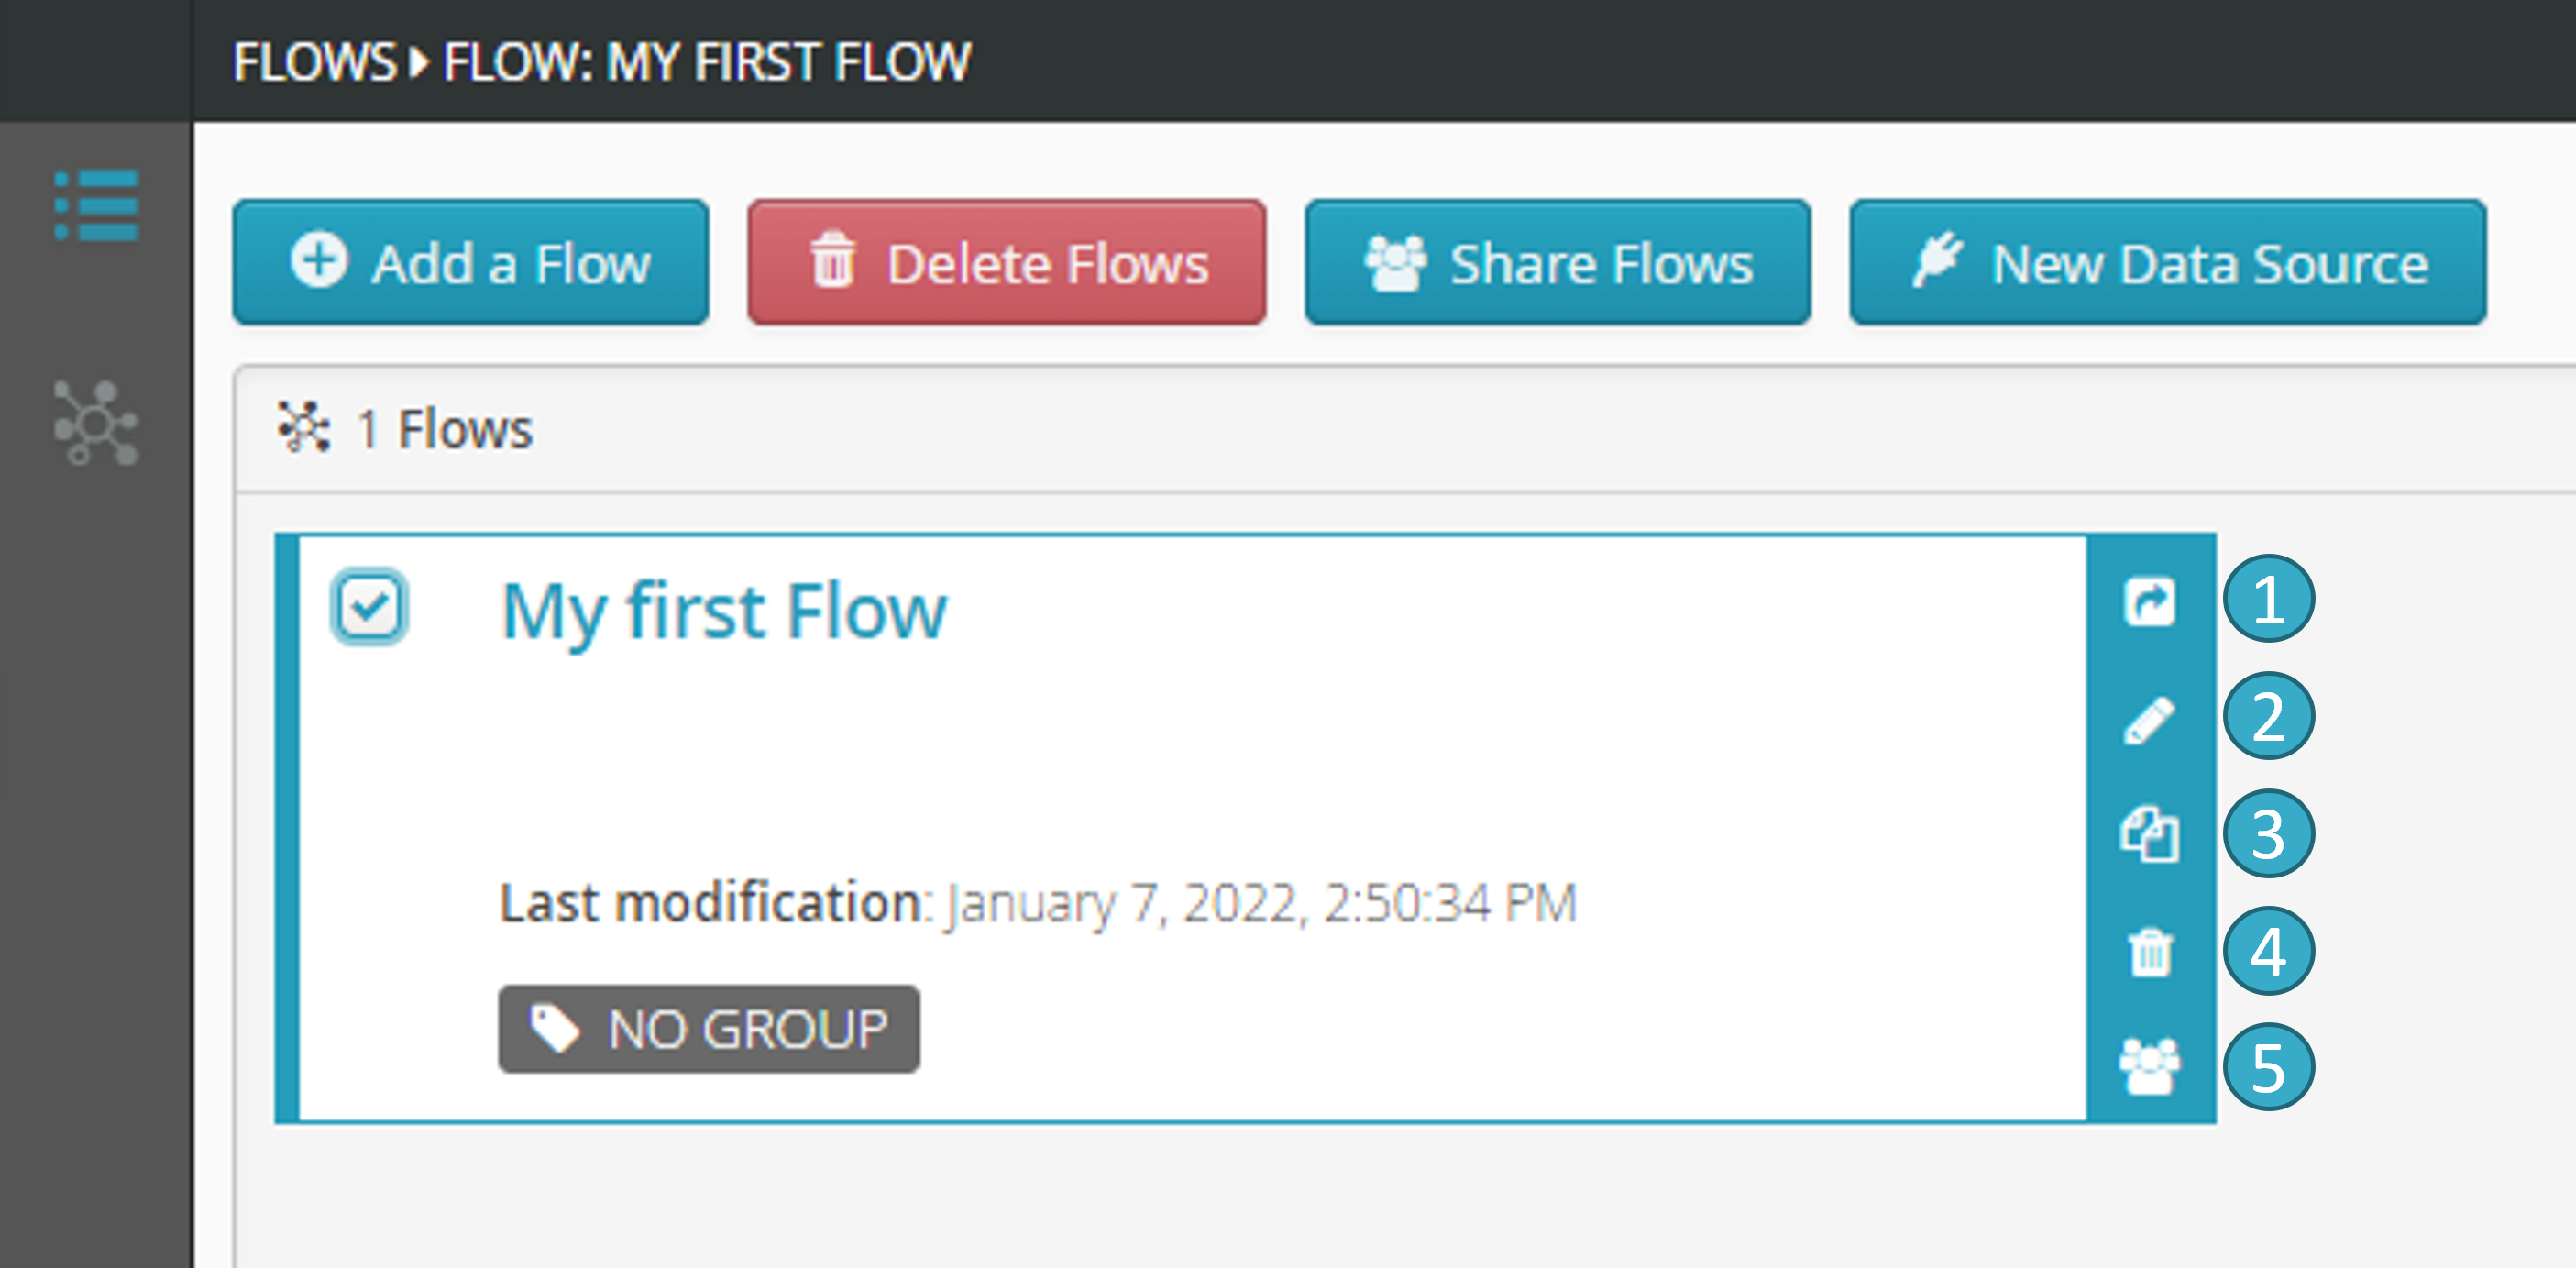
Select the flow you want to alter (by checking the box).
Summary of the palette of processing nodes on the toolbar
Use the reference guide to find detailed information on all Tale of Data processing tools. The following is a brief summary:
A preparation function allows applying a series of transformations to input data, utilizing a range of about a hundred possible types of operations, such as formatting, straightening, deduplication, harmonizing, enriching, and setting and applying validation rules.
A filter node allows selecting fields and records to be sent to each of its outputs.
A validation node sends valid records to its first output and invalid records to its second output, if it has one.
A broadcast node allows duplicating each input record across all outputs.
A join node allows adding information to data, corresponding to adding columns (SQL-style join).
An enrichment node allows, notably using fuzzy matching, to add new fields to a dataset (referred to as the dataset to be enriched or dataset no. 1) from an enrichment dataset (= dataset no. 2, connected by a blue link).
A union node allows adding multiple datasets at the input (stacking), corresponding to adding rows (SQL-style union).
A sort node allows sorting input records based on various criteria.
An aggregation node enables the creation of cross-tabulations.
A window function performs, for each row of the input dataset, one or more calculations on a set of records that are linked to the current record of the input dataset.
Repositories allow repairing or enriching datasets with sophisticated matching algorithms.
