4.12. Aggregation node (= pivot table)
If you want to learn more about this feature, an e-learning tutorial is available below:
Pivot tables with the Aggregation Node
The Aggregation Node can help you produce the same kind of outputs as the Pivot Table in Microsoft Excel can, except that once it is set up, there is no need to do anything else if the upstream data changes. Everything is recalculated every time the flow runs. You don’t need to jiggle anything every time the data changes.
Icon: 
Number of inputs: 1.
Number of outputs: 1.
- Definition
An aggregation node lets you create pivot tables
Warning
A pivot aggregation node requires forcing a full recalculation up to that point. This can affect the preview generation time by several minutes in complex cases
- Configuration
- Using the aggregation node configuration panel you can:
Add several row headers
 .
.Select a field to be pivoted (optional)
 .
.Add one or more measures
 :
:Count - blank field = (*) count(*).
Average.
Sum.
Minimum.
Maximum.
Standard deviation.
Percentile - the percentile parameter can vary between 1 (1er percentile) and 99 (99ème percentile). 50 is the median.
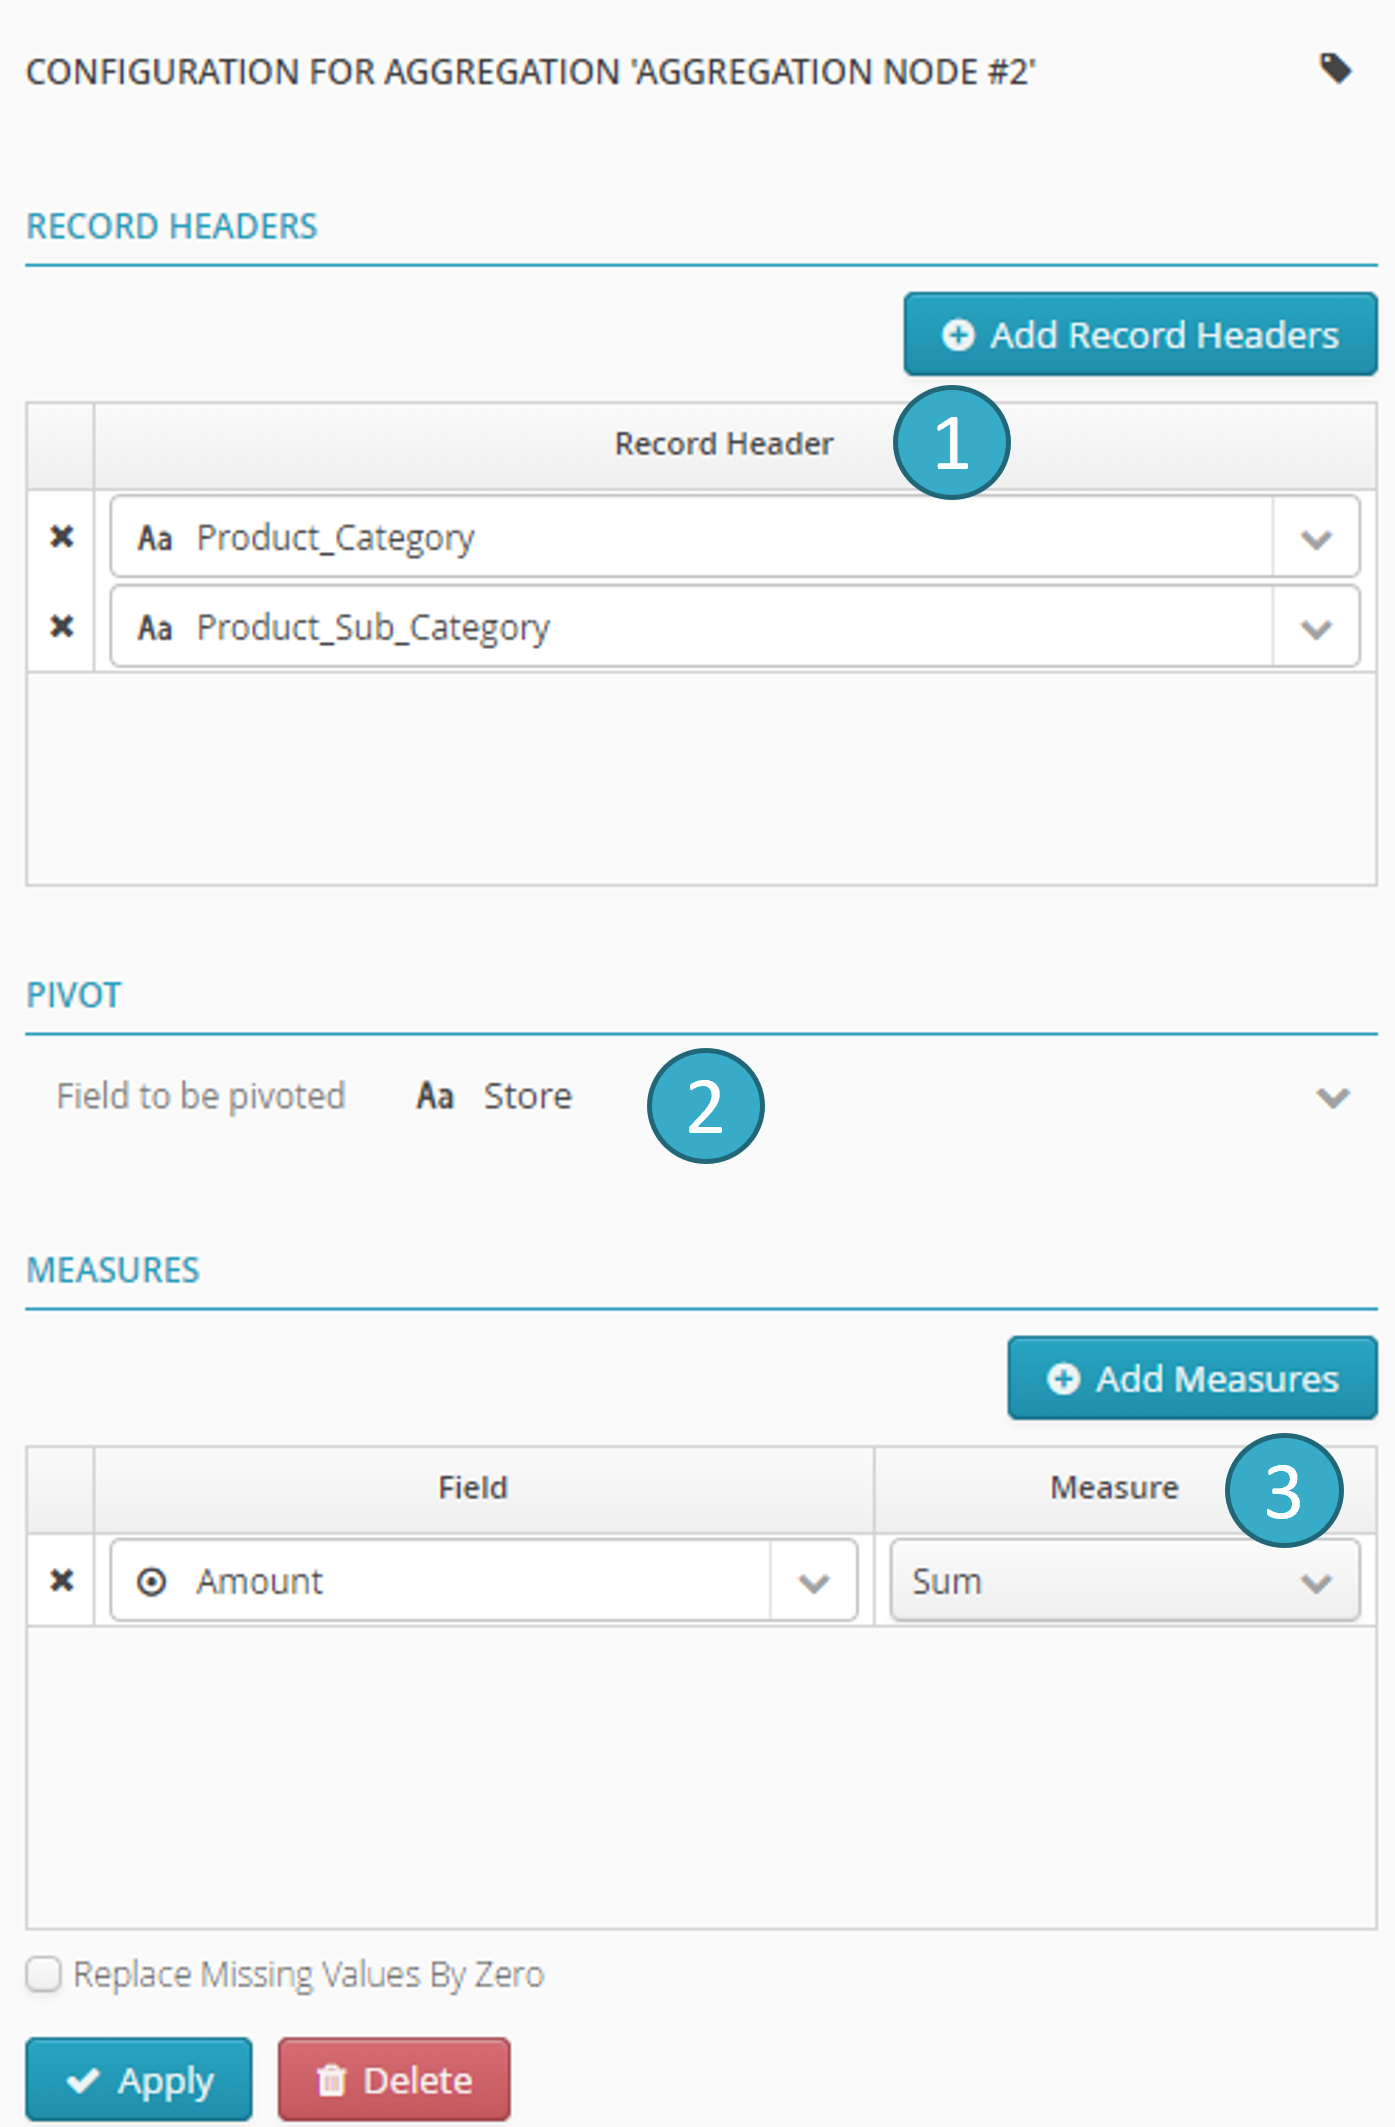
- Visual Example
With the following configuration:
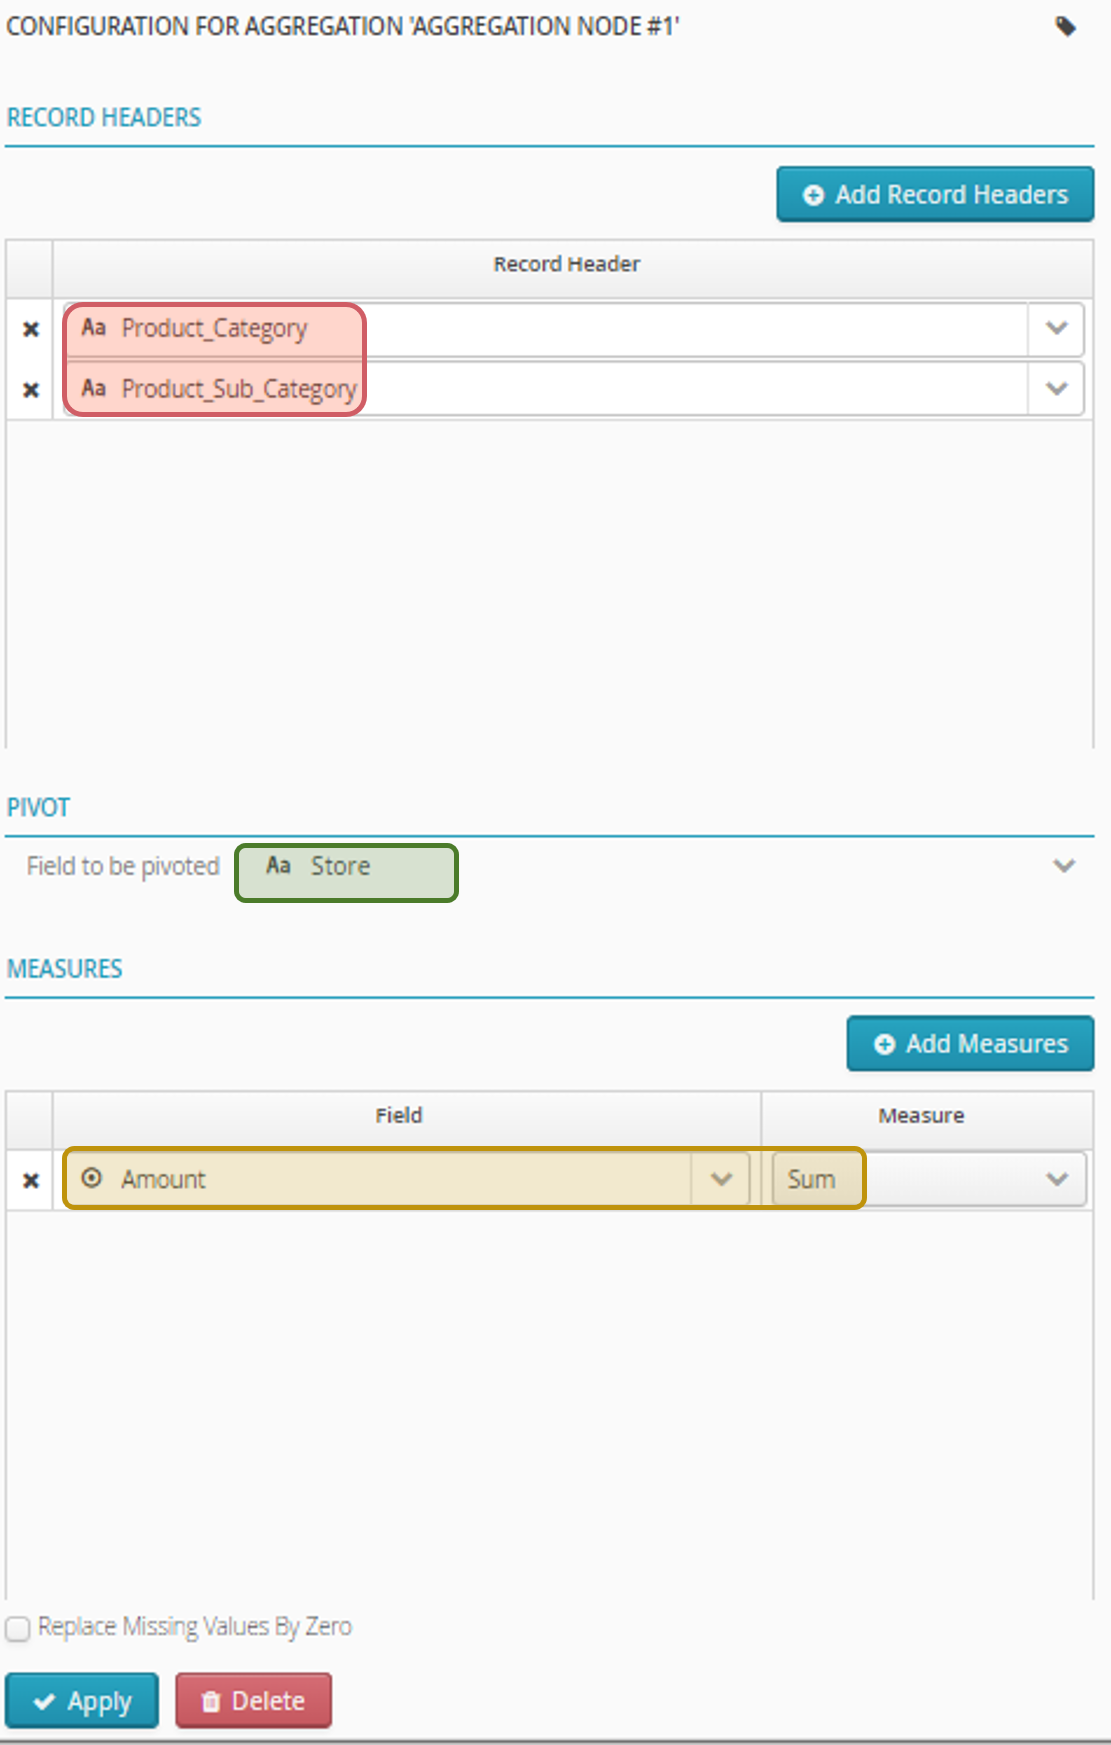
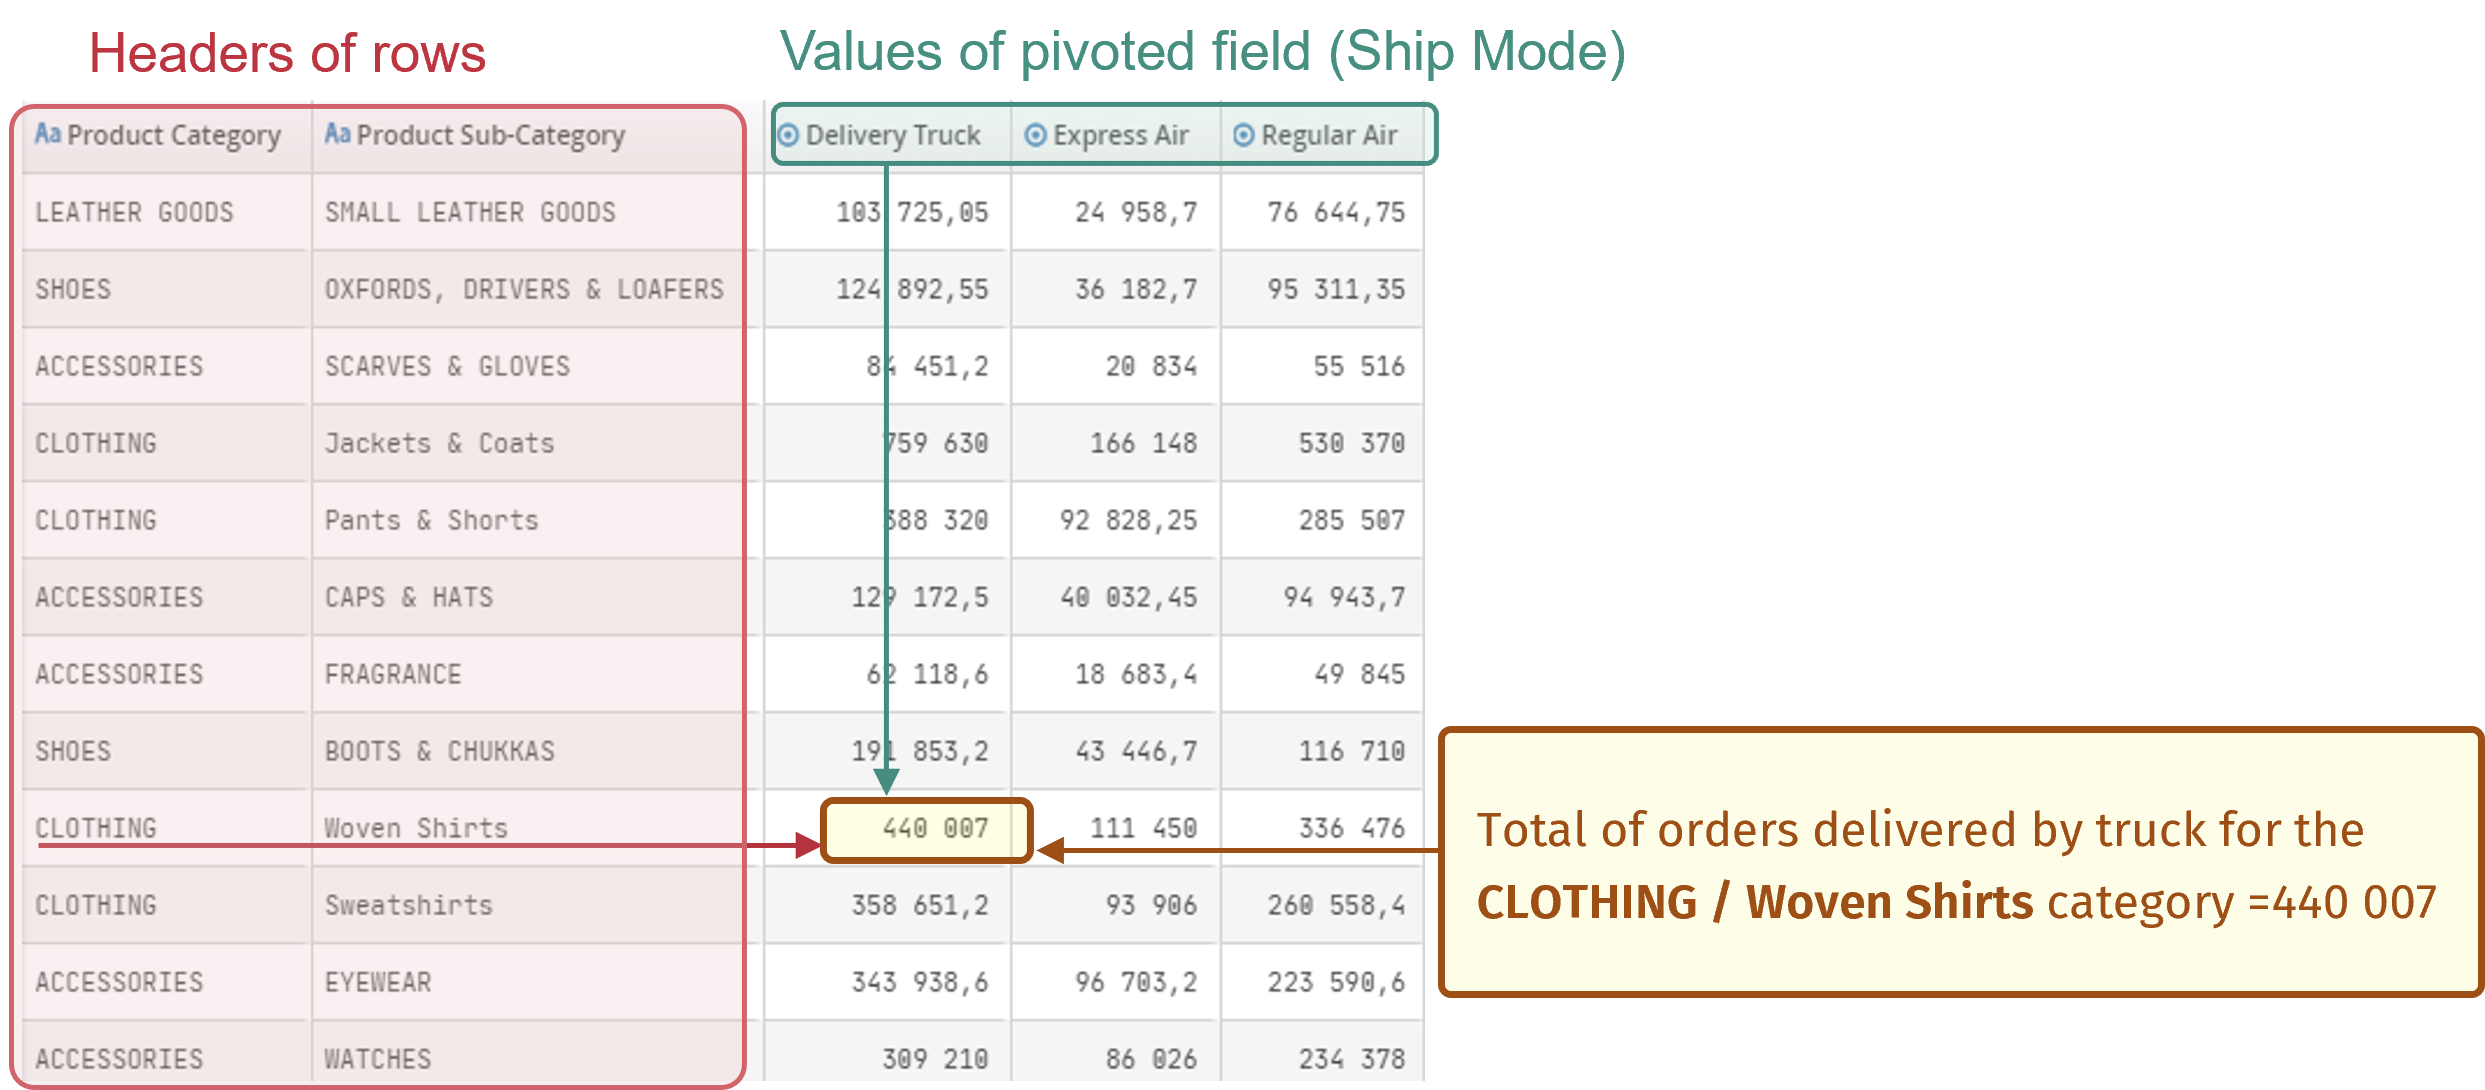
We therefore get:
- Practical examples
Note
Example 1: Basic Summation
Before Operation:
Product
Region
Sales
A
North
100
B
North
150
A
South
200
B
South
120
Node Configuration
Row Header Columns:
ProductMeasure Configurations:
SUM(Sales)
After Operation
Product
South Sales
A
300
B
270
Note
Example 2: Pivot and Aggregation
Before Operation
Product
Region
Sales
A
North
100
B
North
150
A
South
200
B
South
120
Node Configuration
Row Header Columns:
ProductColumn to Be Pivoted:
RegionMeasure Configurations:
SUM(Sales)
After Operation
Product
North Sales
South Sales
A
100
200
B
150
120
Note
Example 3: Percentile Calculation
Before Operation:
Product
Region
Sales
A
North
100
B
North
150
A
South
200
B
South
120
C
East
130
Node Configuration
Row Header Columns:
RegionMeasure Configurations:
PERCENTILE(Sales, 50)
After Operation:
Region
50th Percentile Sales
North
125
South
160
East
130