8.3.3. Comparison with the mean
The comparison with the mean chart presents items in a visual list and based on a numerical value compares them with the average for that value in the table.
It may be useful to set scroll authorisation in “wrench”, especially if there are a lot of items on the list.
sort options can also be useful in refining the desired sort of the list, in organising the sort by deviation from average or alphabetically; for example.
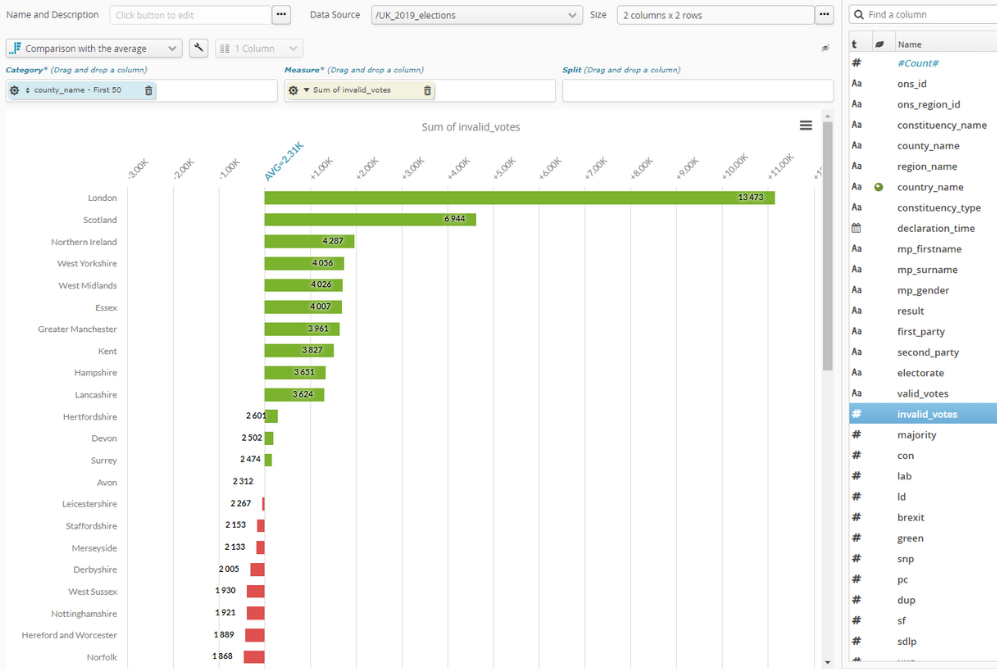
The chart is read as follows:
AVG=on the horizontal axis is the average value of the wholethe graduations on the horizontal axis measure the deviation from average based on the length of each bar.
the value shown beside each bar is the value of the item concerned (does not take account of the total item average).
Other available parameters are:
the bar coloring rule that is also available under “wrench”.
the number of items to show and inclusion/non inclusion of``Display other categories``, with the sprocket for the category.
Pour les champs numériques utilisés pour la mesure, la roue dentée du champ de la mesure permet de paramétrer le mode de mesure. Ceci permet de choisir, à partir de ce champ numérique, ce qu’il faut calculer. Les calculs disponibles sont :
number of items (Number)
item average (Average)
sum of items (Sum)
smallest item (Minimum)
biggest item (Maximum)