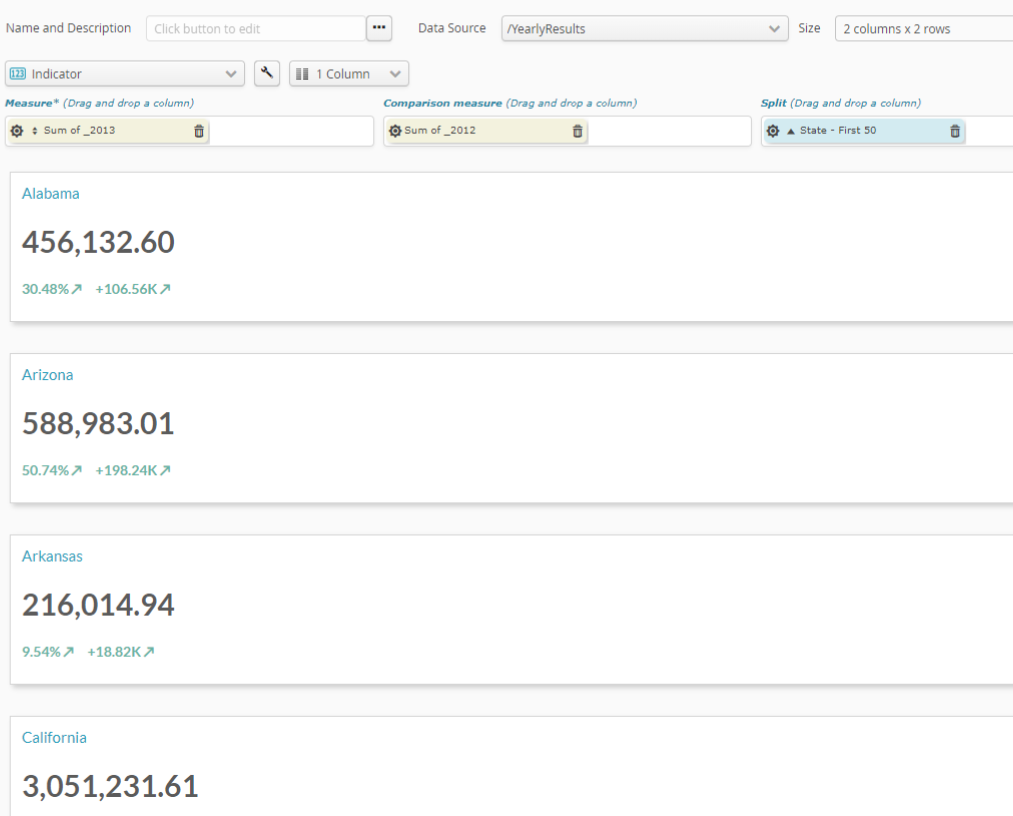
6.3.12. Indicator
An indicator chart lets you quantify a numerical value.

The key field in the chart is the Measurement.
You can include a comparison measurement to make a comparison (small figures).
a distribution field can be very useful when creating a set of indicators that iterates over a particular category.
Pour les champs numériques utilisés pour la mesure, la roue dentée du champ de la mesure permet de paramétrer le mode de mesure. Ceci permet de choisir, à partir de ce champ numérique, ce qu’il faut calculer. Les calculs disponibles sont :
number of items (Number)
item average (Average)
sum of items (Sum)
smallest item (Minimum)
biggest item (Maximum)