7.19. Advanced transformations
7.19.1. Split an Array
The transformation will divide the record in the input table into three records:
input table:
A
B1,B2,B3
C
output table:
A
B1
C
A
B2
C
A
B3
C
The transformation will apply to just one field.
The transformation will use the active filter(s).
Note
Practical example : Split an Array
Before Transformation:
ID |
Products |
|---|---|
1 |
Apple, Banana, Grape |
2 |
Orange; Mango |
3 |
PeachnPineapple |
In this example, the Products column contains multiple items separated by commas, semicolons, and line breaks.
Transformation Configuration:
Target Column:
ProductsSeparator Characters:
,;Characters to Remove:
""(none)Use Line Breaks as Separator:
trueFilters: None (apply to all rows)
After Transformation:
ID |
Products |
|---|---|
1 |
Apple |
1 |
Banana |
1 |
Grape |
2 |
Orange |
2 |
Mango |
3 |
Peach |
3 |
Pineapple |
The transformed dataset now contains each product as a separate entry, making it easier to analyze individual products without dealing with concatenated lists.
7.19.2. Business Rule Set Dataset
Note
If you want to learn more about this feature, an e-learning tutorial is available below:
Using Business Rules to amend your data
If you haven’t yet started to use Business Rules, now is the time to find out more about them! You can use these to make any changes you want to your data. We give you some basic examples that will get you started. The rest you will find easy, and will grow depending on what particular problem you want to solve.
A set of business rules allows you, without having to write any code, to:
Make calculations for the current record.
Add new fields whose values will be calculated based on the fields in the current record.
Calculation business rules are structured as follows:
IF: <Add conditions separated by AND/OR>.
Then: <Add the calculations required if condition IF has been met>.
Else: <Add the calculations required if condition IF has not been met>.
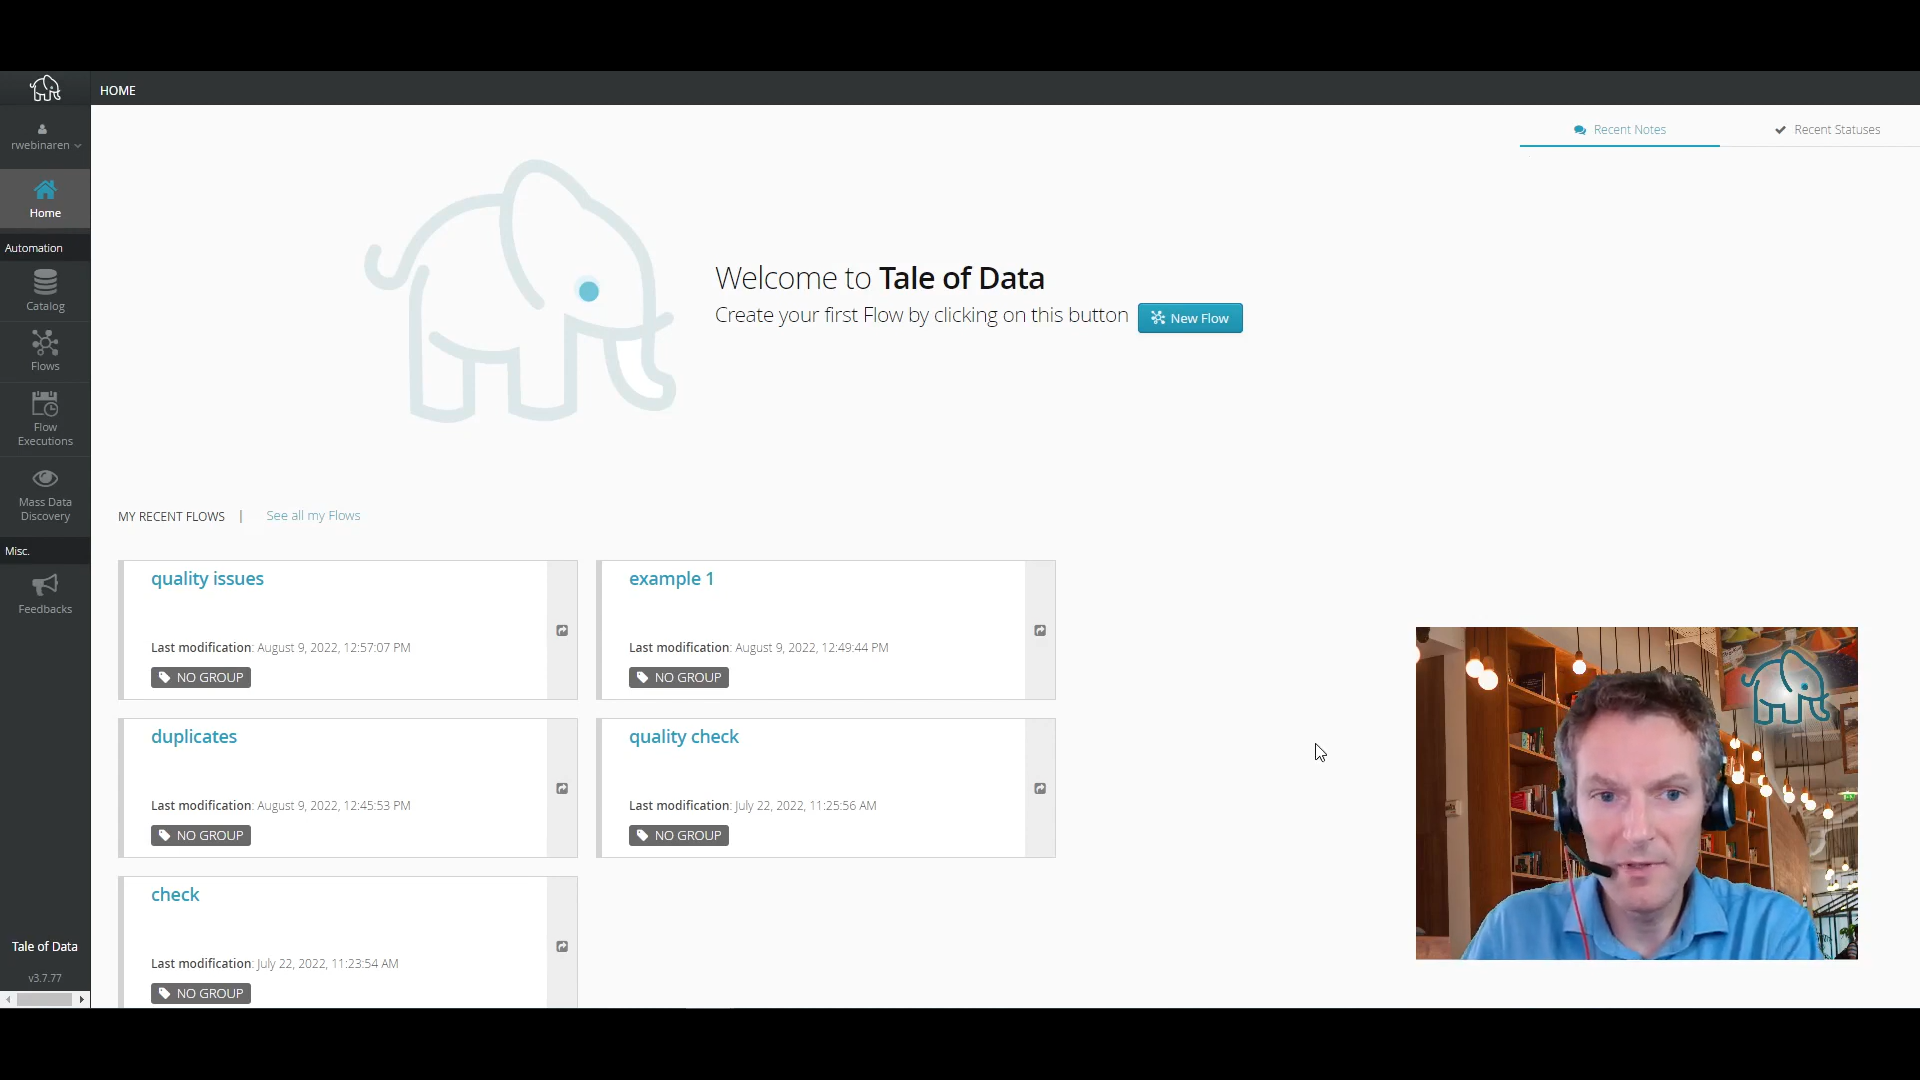
Click Ajouter to create a new calculation rule:
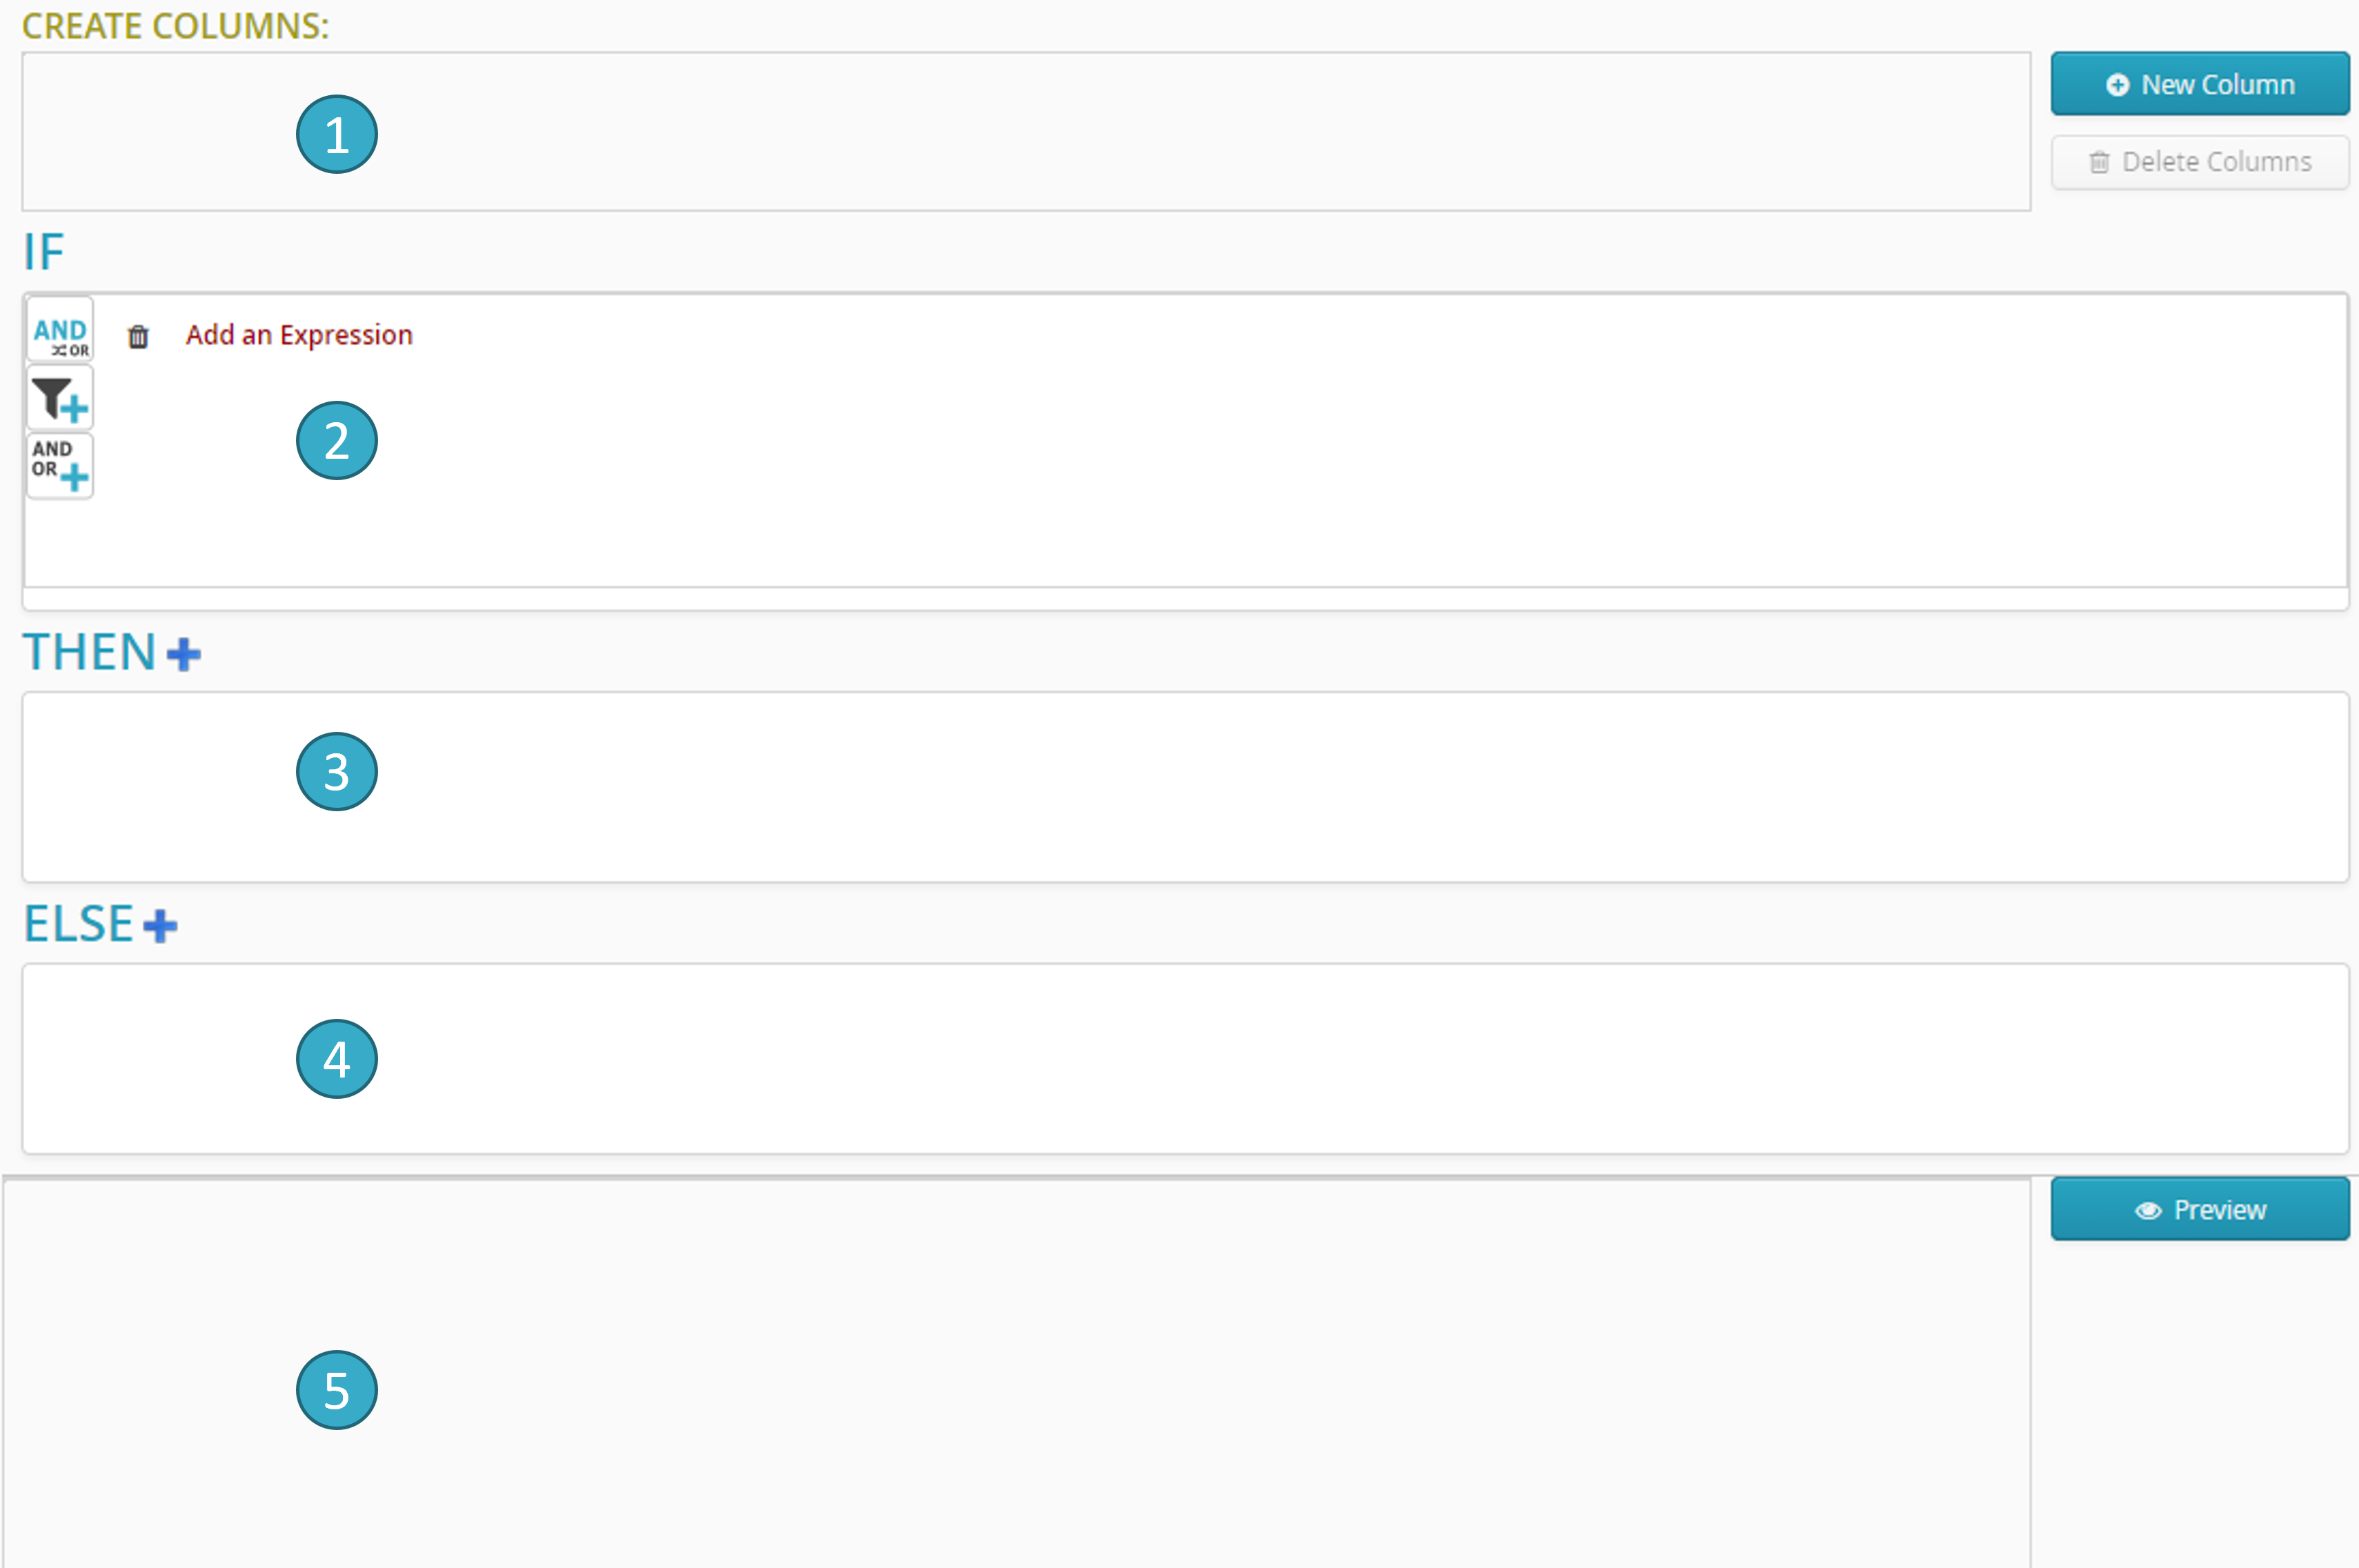
The *business rules editor* will show the following zones:
Zone for creating new calculated fields
.
Zone for defining condition IF
.
Zone for THEN clause calculations
.
Zone for ELSE clause calculations
.
Zone for previewing calculation results
.
To add a condition, click “Add an Expression” in the zone . A dialogue window will open.
In the left section of a condition, you can add:
A field
An arithmetic expression
A function
As the screen capture below shows, you must then add the right section of the condition by clicking Add an Expression to the right of the operator:
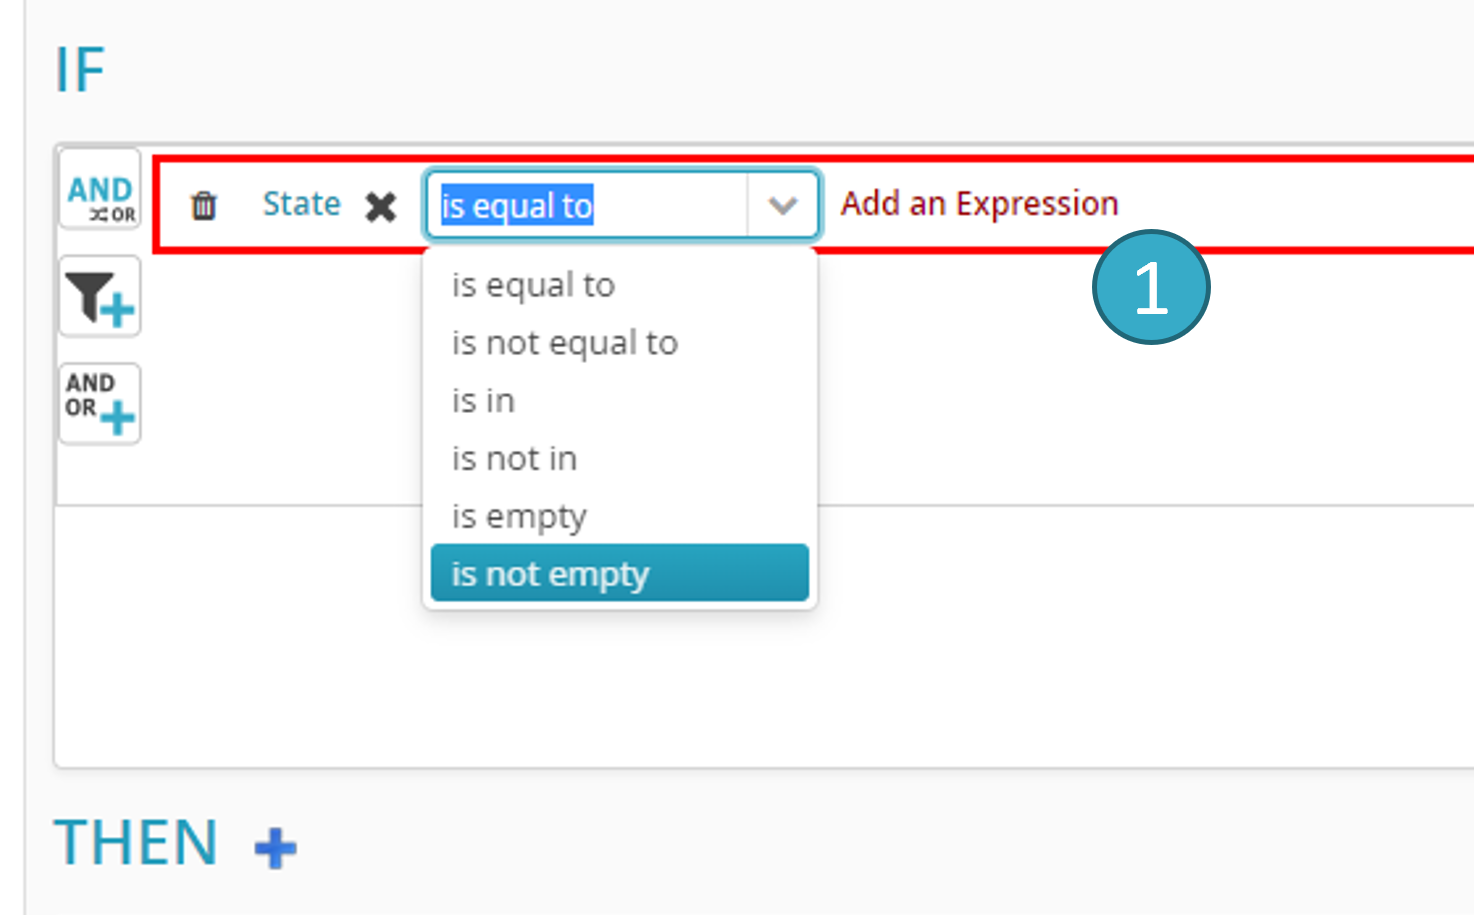
In the right section of a condition you can enter:
A literal (a number, text, date, etc.).
The value of another field (e.g. IF field1 = field2).
The result of a function.
To add a calculation to a THEN or ELSE clause, click + in the zone or . A dialogue window similar to the condition editing window will let you assign the result of a calculation to fields. The calculation may be:
A literal (e.g. field1 = 12).
The value of another field (e.g. field1 = field2).
The result of a function (e.g. field1 = first 3 characters of field2).
An arithmetic expression (e.g. field1 = field2 * field3 + 10).
The deletion of a business rule is done by clicking on the delete button next to the relevant rule, or on the button at the top to delete all business rules present in the preparation editor:
Note
Practical example : Add a Business rule
Before Transformation:
ID |
Sales |
Region |
|---|---|---|
1 |
150 |
East |
2 |
200 |
West |
3 |
120 |
East |
Transformation Configuration:
Rule 1:
If the region is 'East', add 10% to the sales.Rule 2:
If the sales are greater than 180, label as 'High'; otherwise, label as 'Normal'.
After Transformation:
ID |
Sales |
Region |
Adjusted Sales |
Label |
|---|---|---|---|---|
1 |
150 |
East |
165 |
Normal |
2 |
200 |
West |
200 |
High |
3 |
120 |
East |
132 |
Normal |
In this example, the transformation first adjusts the sales figures based on the region. Following this, it applies a label based on the adjusted sales figure.
Note
Practical example : Update Business Validation Rule
Suppose a Business Validation Rule is set indicating that IF the age is greater than or equal to 30 THEN the status must be inactive.
Before Transformation:
ID |
Name |
Age |
Status |
|---|---|---|---|
1 |
Alice |
34 |
Active |
2 |
Bob |
17 |
Active |
3 |
Charlie |
25 |
Active |
According to this rule, the first row is marked as invalid.
Transformation Configuration:
For example, suppose you update the Business Validation Rule as follows: IF the age is greater than or equal to 22 THEN the status must be inactive
After Transformation:
ID |
Name |
Age |
Status |
|---|---|---|---|
1 |
Alice |
34 |
Active |
2 |
Bob |
17 |
Active |
3 |
Charlie |
25 |
Active |
Once the business validation rule has been updated, only the second line remains valid.
Note
Practical example : Delete a Business Validation rule
Suppose a Business Validation Rule is set indicating that IF the age is greater than or equal to 30 THEN the status must be inactive.
Before Transformation:
ID |
Name |
Age |
Status |
|---|---|---|---|
1 |
Alice |
34 |
Active |
2 |
Bob |
17 |
Active |
3 |
Charlie |
25 |
Inactive |
Selon cette règle, la première ligne ci-dessus est marquée comme invalide.
Transformation Configuration:
No configuration, just remove, in the preparation editor, the Business Validation rule IF the age is greater than or equal to 30 THEN the status must be inactive
After Transformation:
ID |
Name |
Age |
Status |
|---|---|---|---|
1 |
Alice |
34 |
Active |
2 |
Bob |
17 |
Active |
3 |
Charlie |
25 |
Inactive |
Once the business validation rule has been removed, all lines are now valid.
7.19.3. Generate Unique Identifiers
Generate a UUID (universally unique identifier) in a new field for each current dataset record.
The transformation will not apply to any field.
The transformation will not use the active filter(s).
Note
Practical example : Generate Unique Identifiers
Before Transformation:
Record ID |
Name |
|
|---|---|---|
1 |
Alice |
|
2 |
Bob |
Transformation Configuration:
New Column Name: “Unique ID”
After Transformation:
Record ID |
Name |
Unique ID |
|
|---|---|---|---|
1 |
Alice |
123e4567-e89b-12d3-a456-426614174000 |
|
2 |
Bob |
987e6543-e21b-12d3-a456-426614174000 |
7.19.4. Negate Boolean Value
Invert (true/false) Boolean values in selected fields:
True values will become false.
False values will become true.
Other values will be unchanged.
The transformation will apply to one or more fields.
The transformation will use the active filter(s).
Note
Practical example : Negate Boolean Value
Before Transformation:
Device ID |
GPS Enabled |
WiFi Enabled |
|---|---|---|
001 |
true |
false |
002 |
false |
true |
Transformation Configuration:
For this example, let’s choose to negate the values in the ‘GPS Enabled’ and ‘WiFi Enabled’ columns.
Target Columns: GPS Enabled, WiFi Enabled
After Transformation:
Device ID |
GPS Enabled |
WiFi Enabled |
|---|---|---|
001 |
false |
true |
002 |
true |
false |
This transformation effectively inverts the boolean settings for each device, toggling the enabled/disabled status for GPS and WiFi features.
7.19.5. Reconcile / Enrich with Repository data
Go to the section Using repositories.
7.19.6. Script Based
7.19.6.1. Description
Open-source scripting language (Groovy [16]) gives read or write access to all the cells in a record.
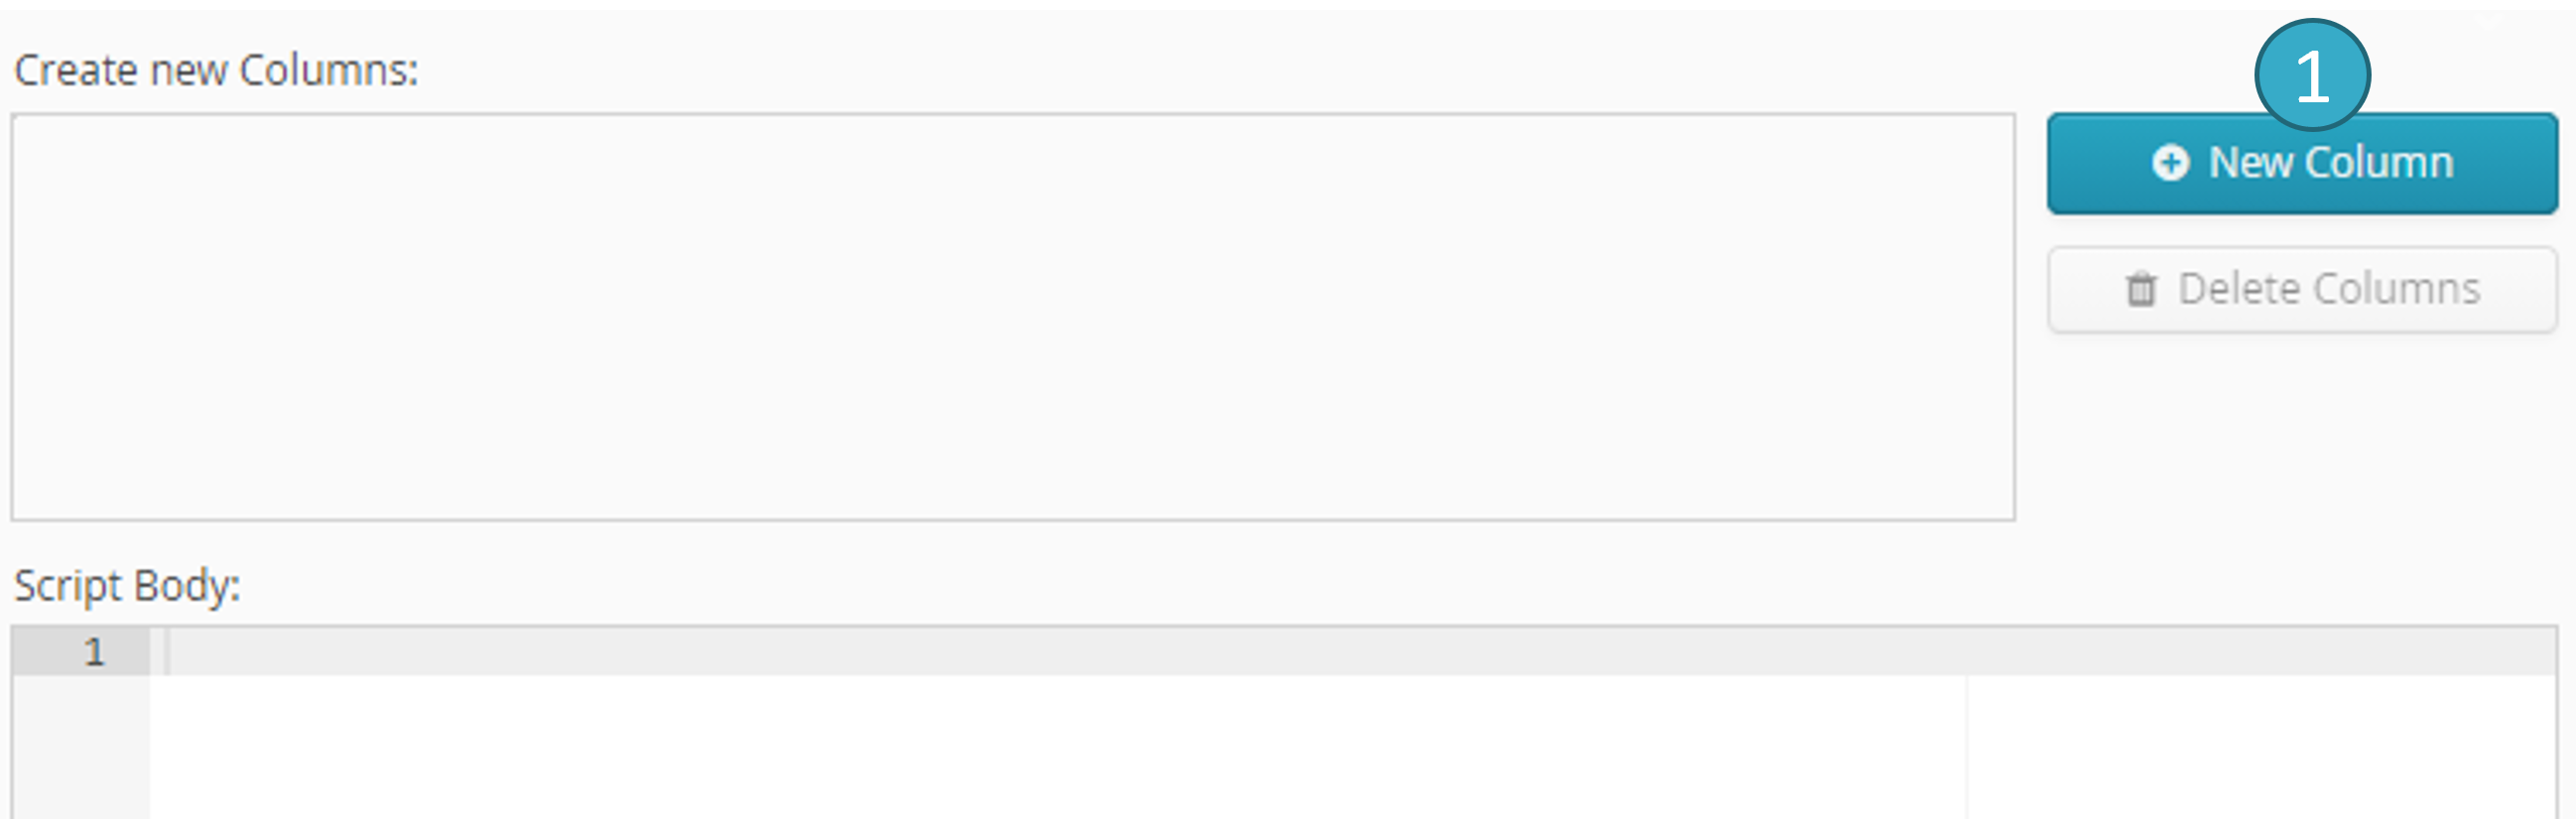
You can create new fields.
To do this, click New Column to enter the name and type of field to be added:
All basic arithmetic operations will then become available together with hundreds of functions for manipulating text, numbers and dates (the scripting language therefore allows you to create potentially complex business rules for your data).
Groovy will be available in its entirety: loops, controls, collection manipulation, variable creation, etc. (http://www.groovy-lang.org/groovy-dev-kit.html).
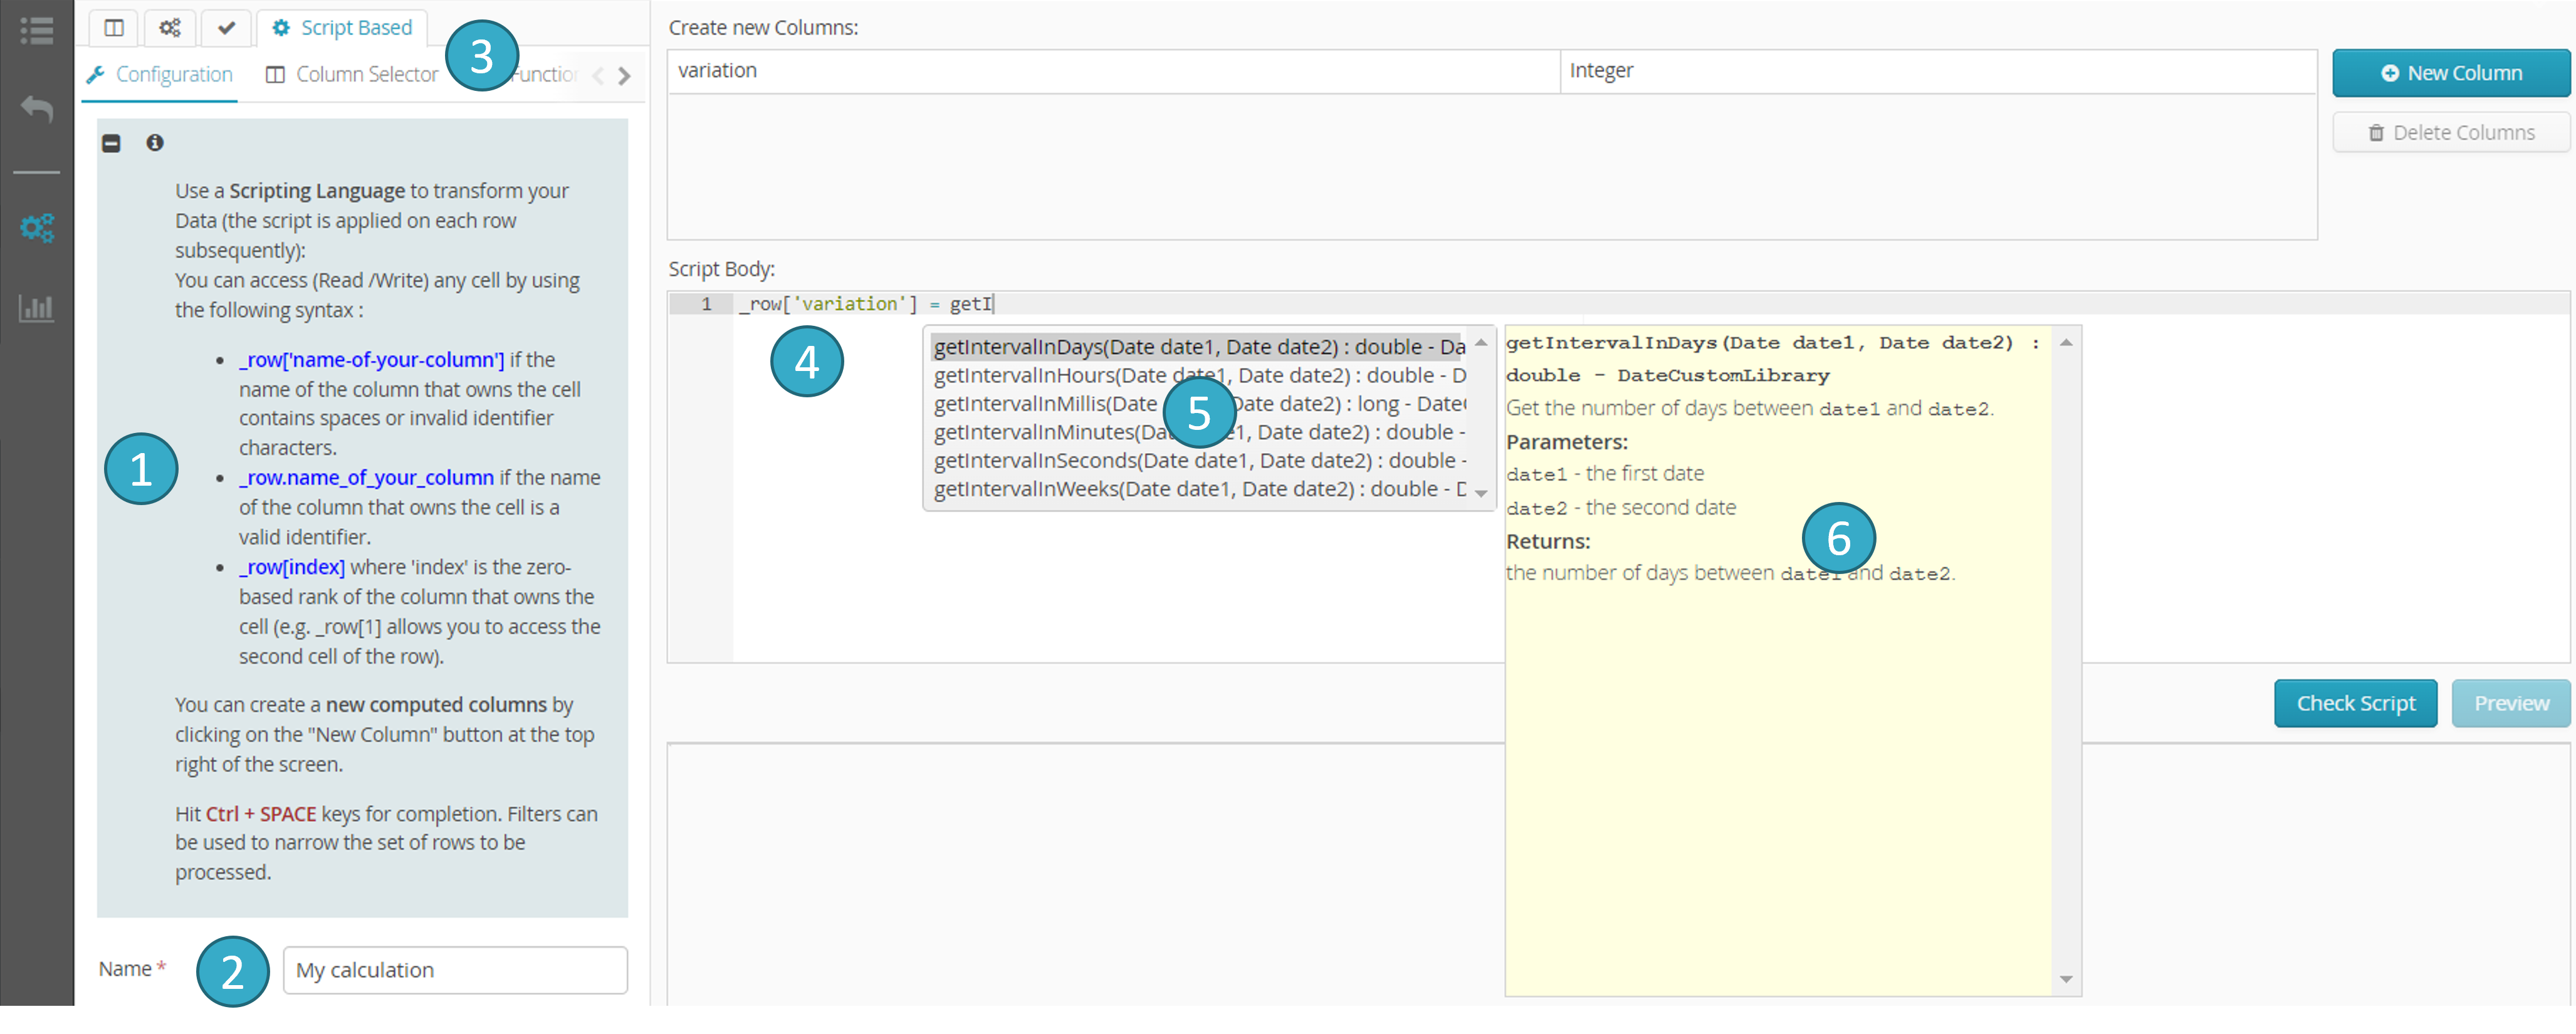
Help zone
: this offers syntax information for reading and writing in existing fields and for creating new fields.Information to be provided on the script
: name, comment, etc.Two additional tabs
: a field selector and a function selector (see below for further details).Zone for entering script text
.Autocomplete
(Ctrl + Space).Help with the selected completion option
 .
.
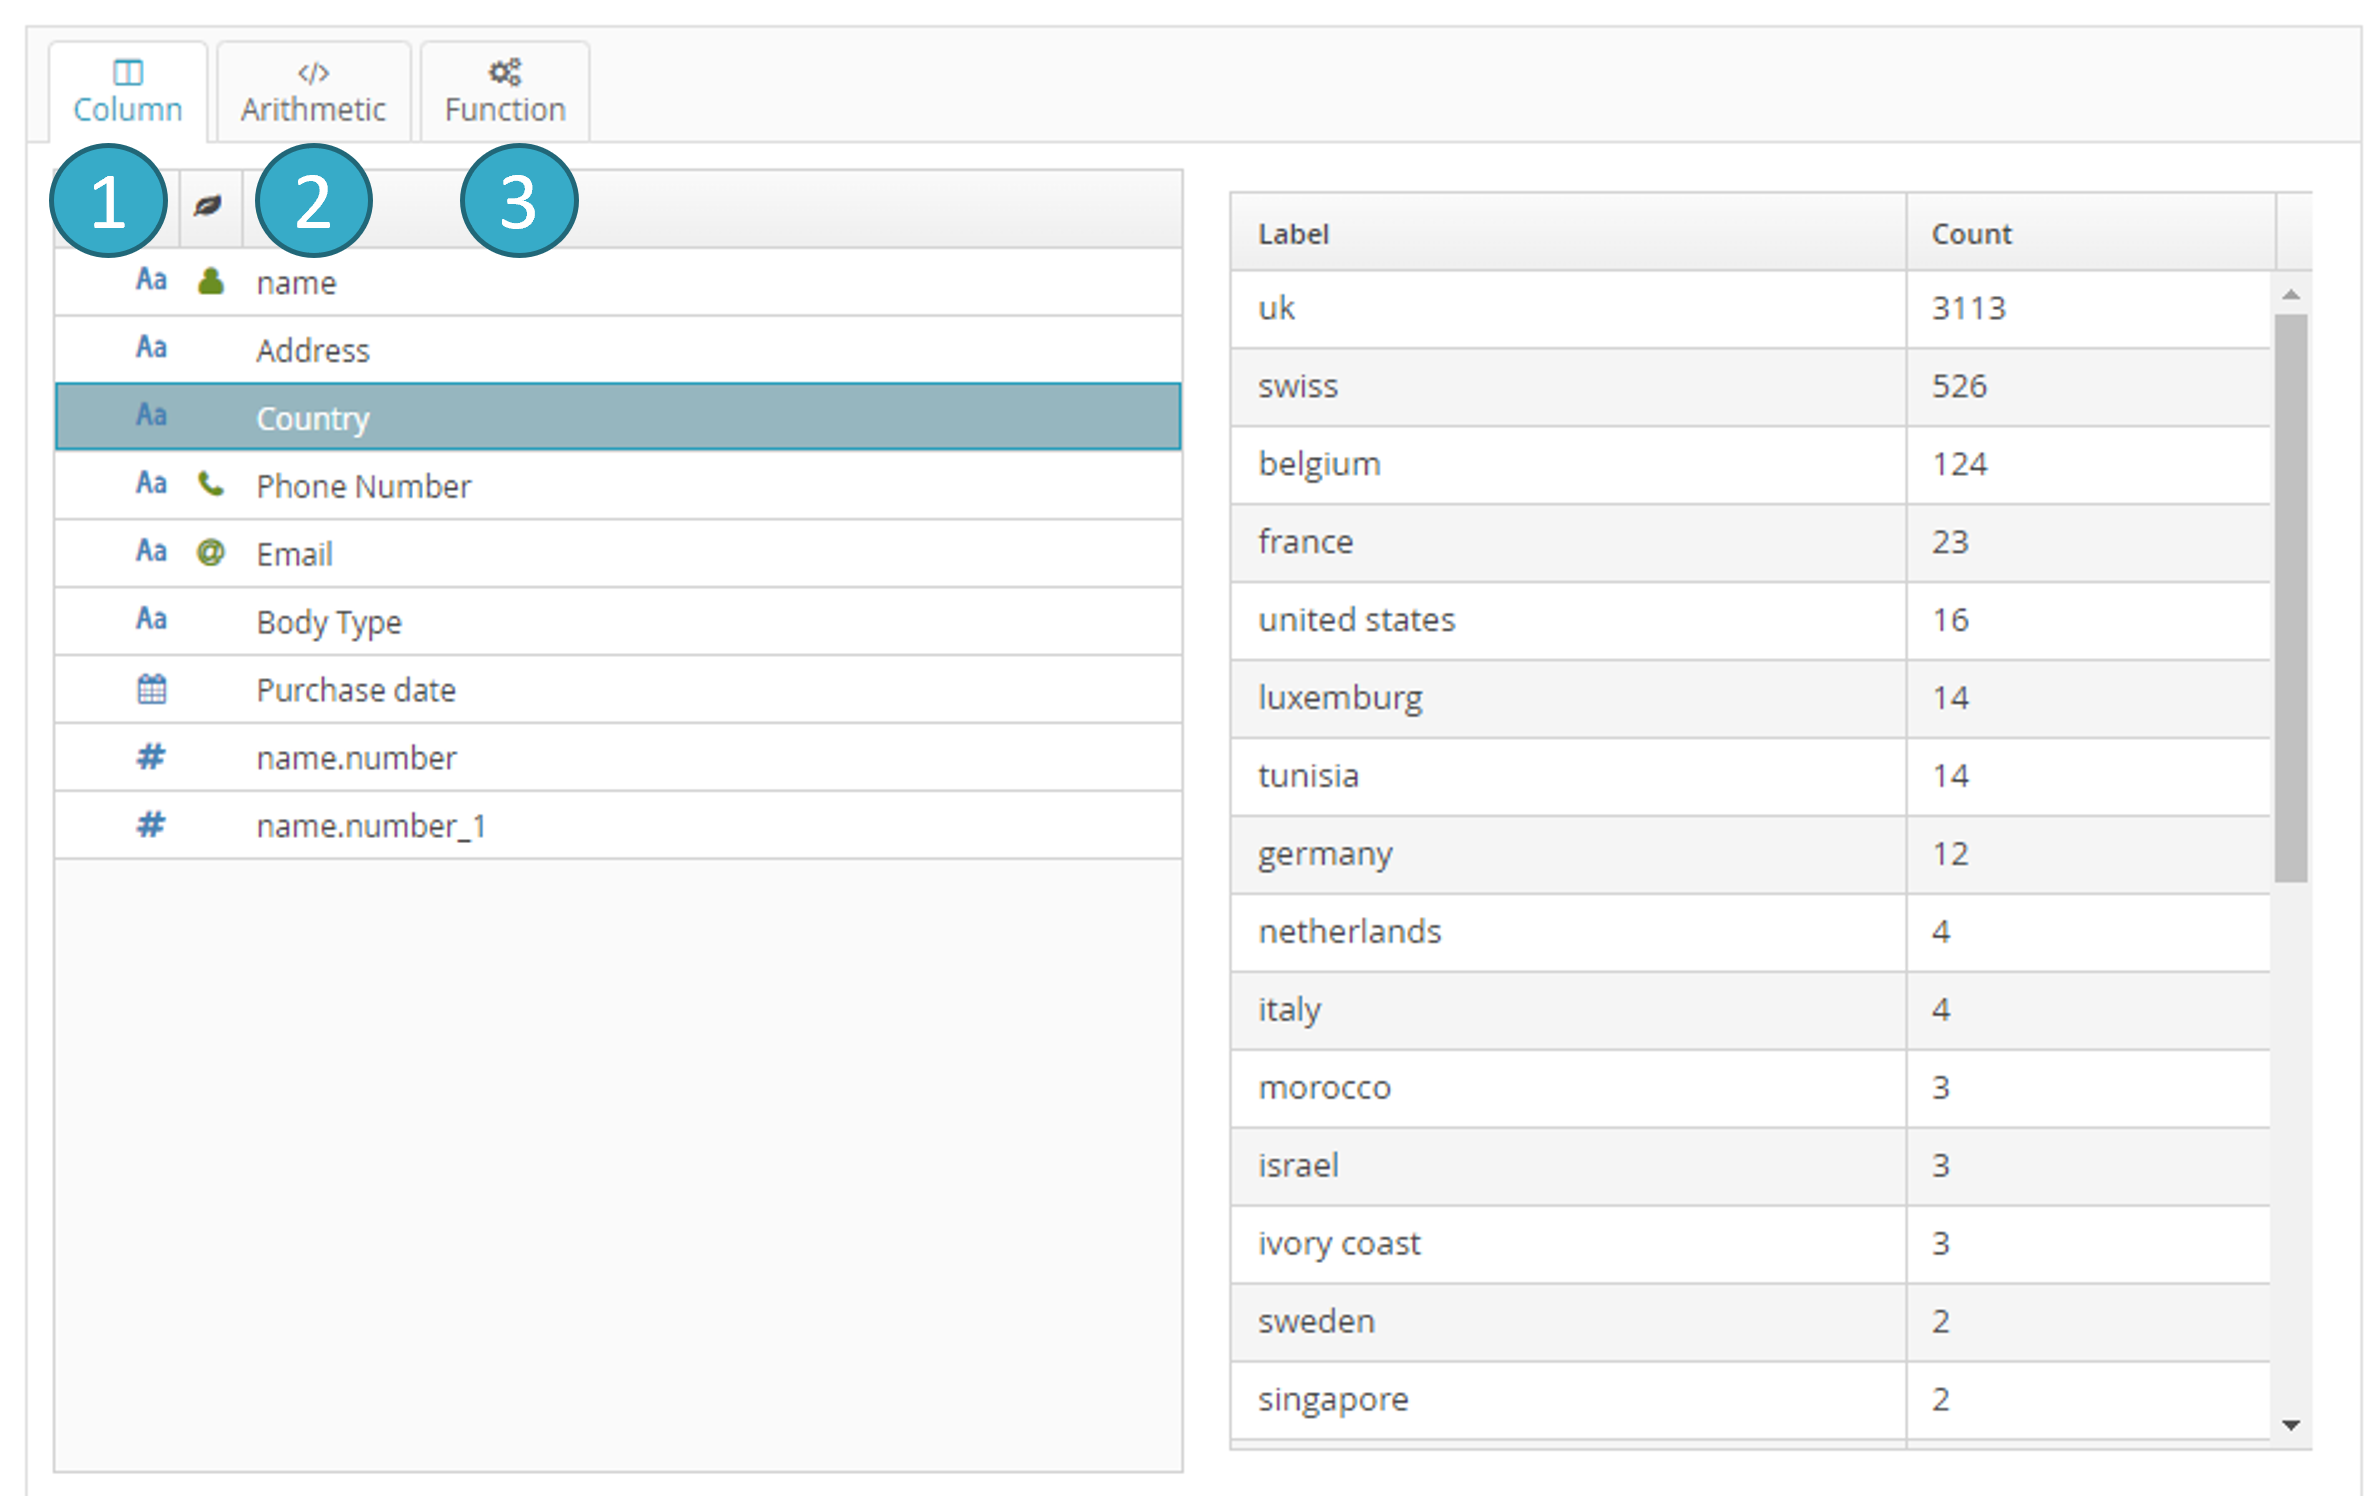
7.19.6.2. Field selector tab
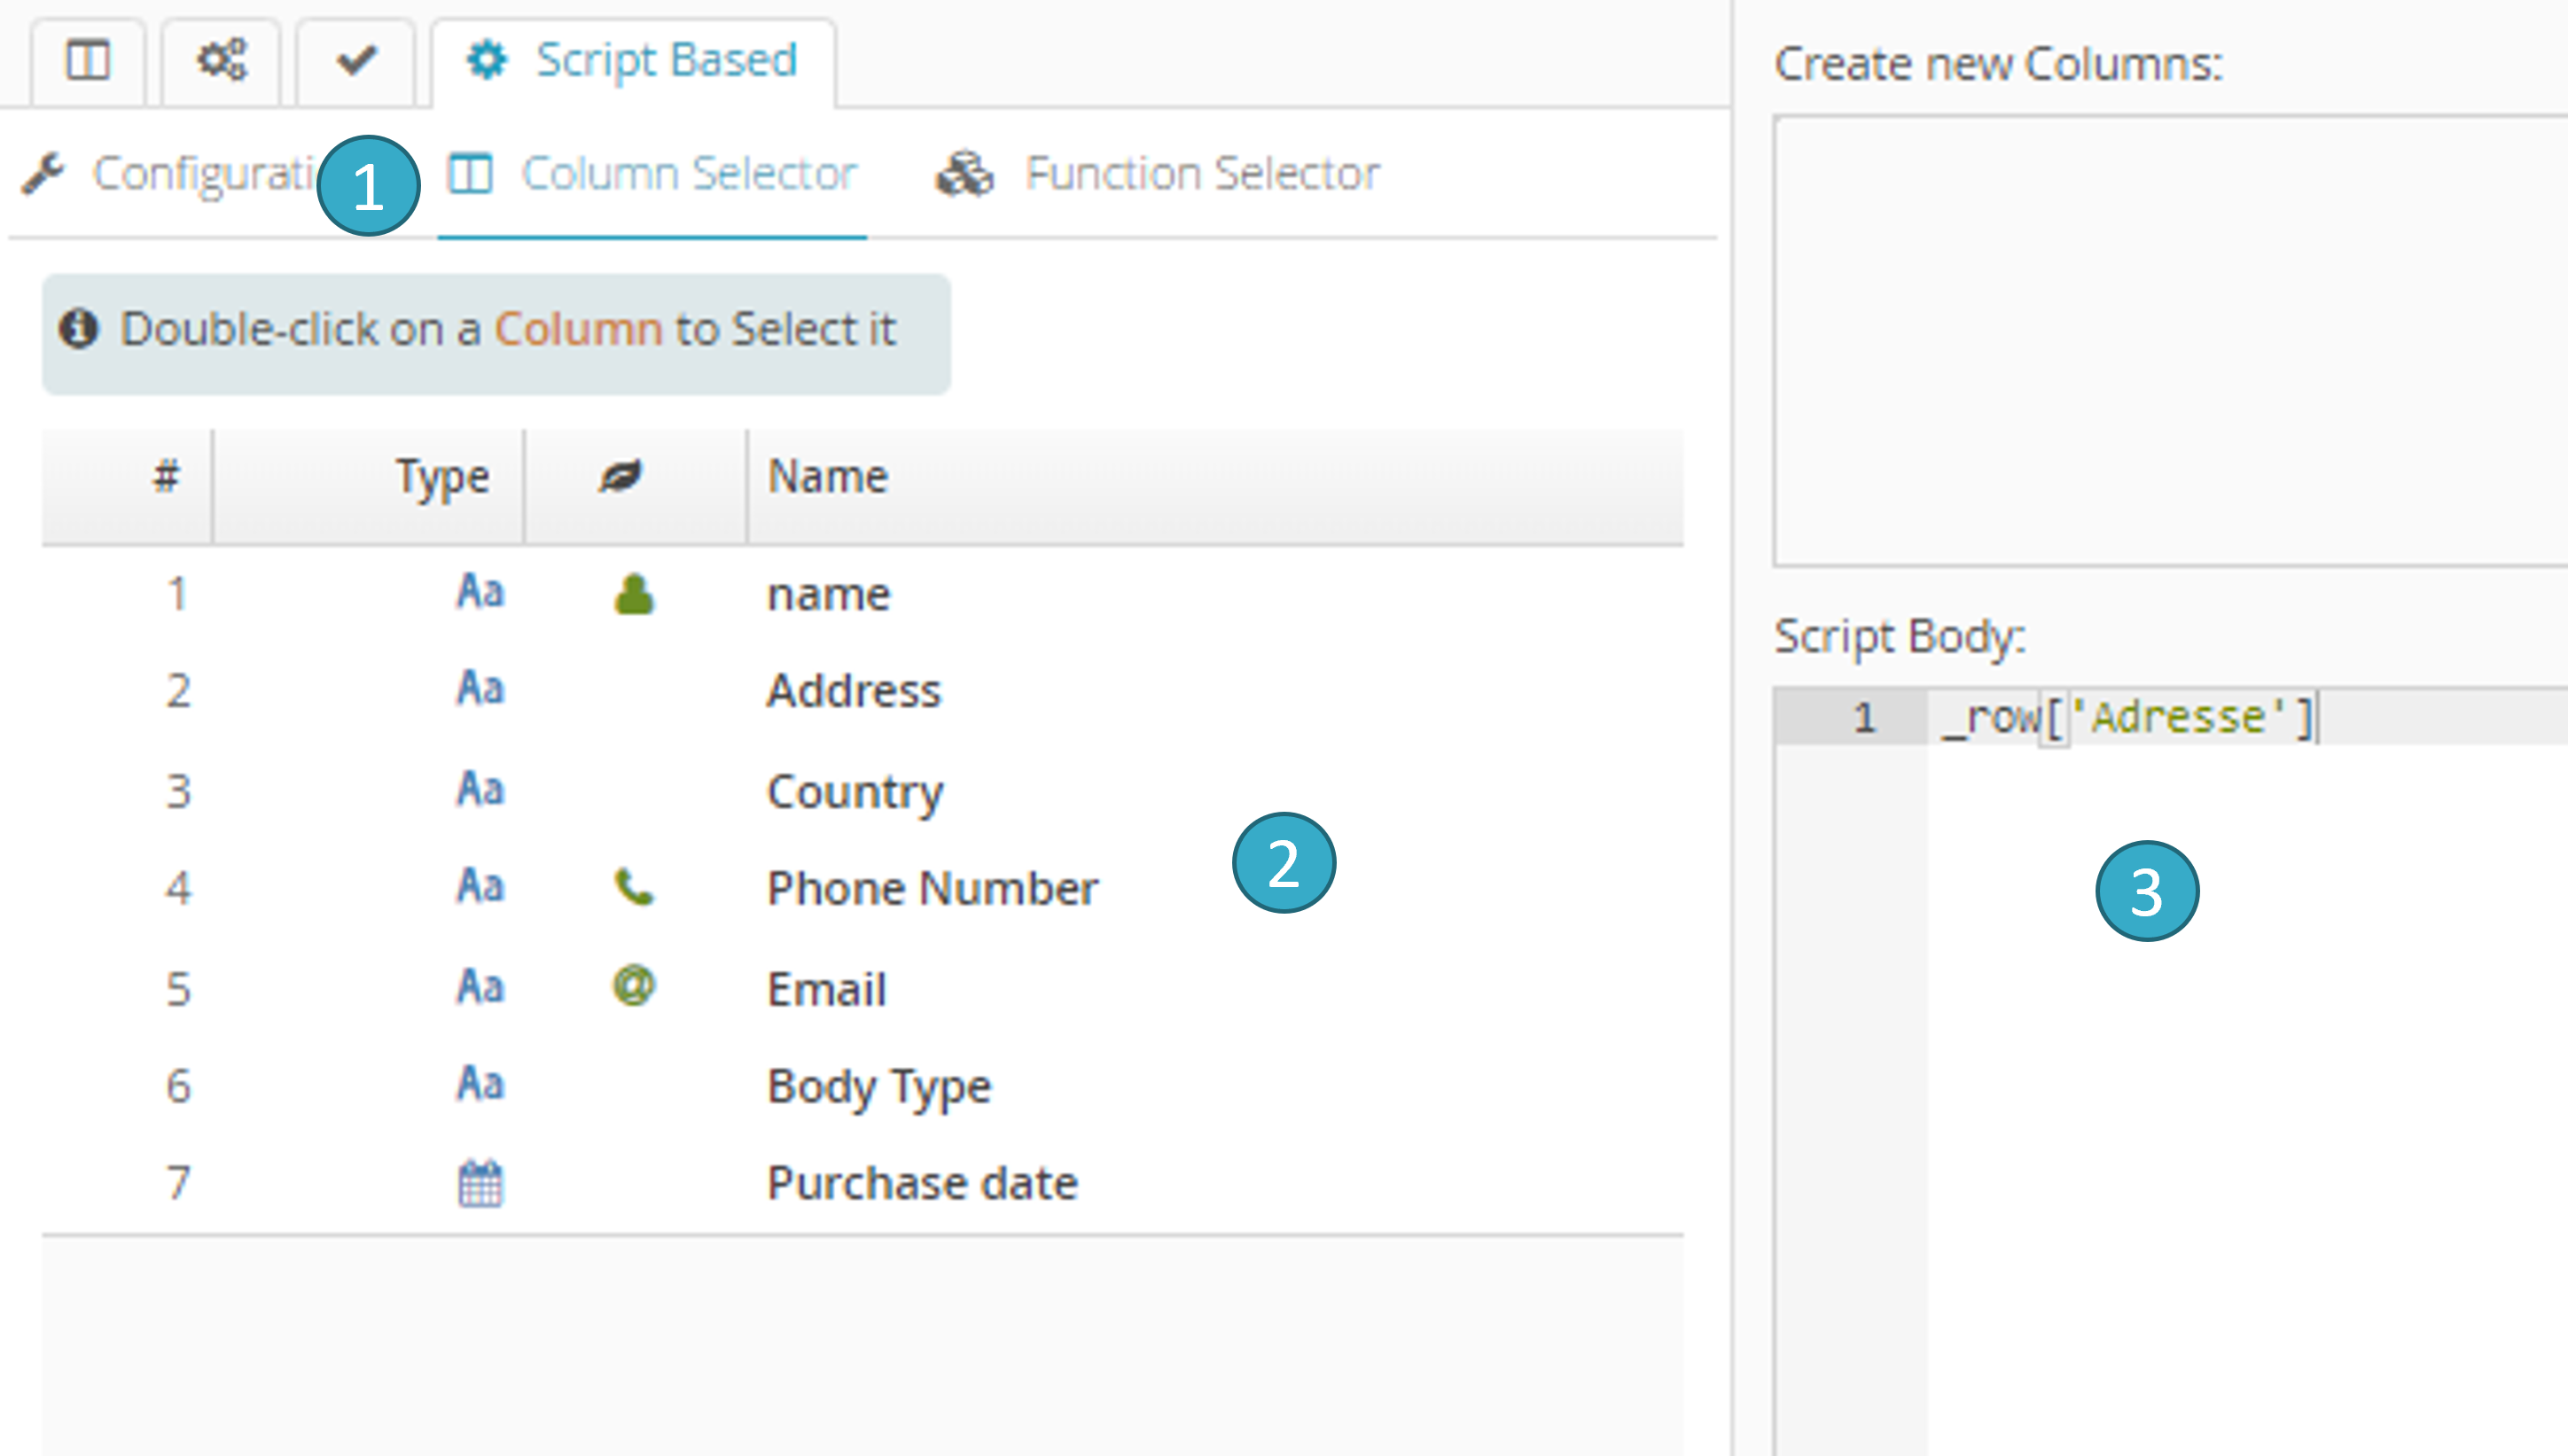
Select the Column Selector tab
.Double-click a field
.… to input the appropriate syntax into the script zone
.
7.19.6.3. Function Selector tab (alternative to autocomplete)
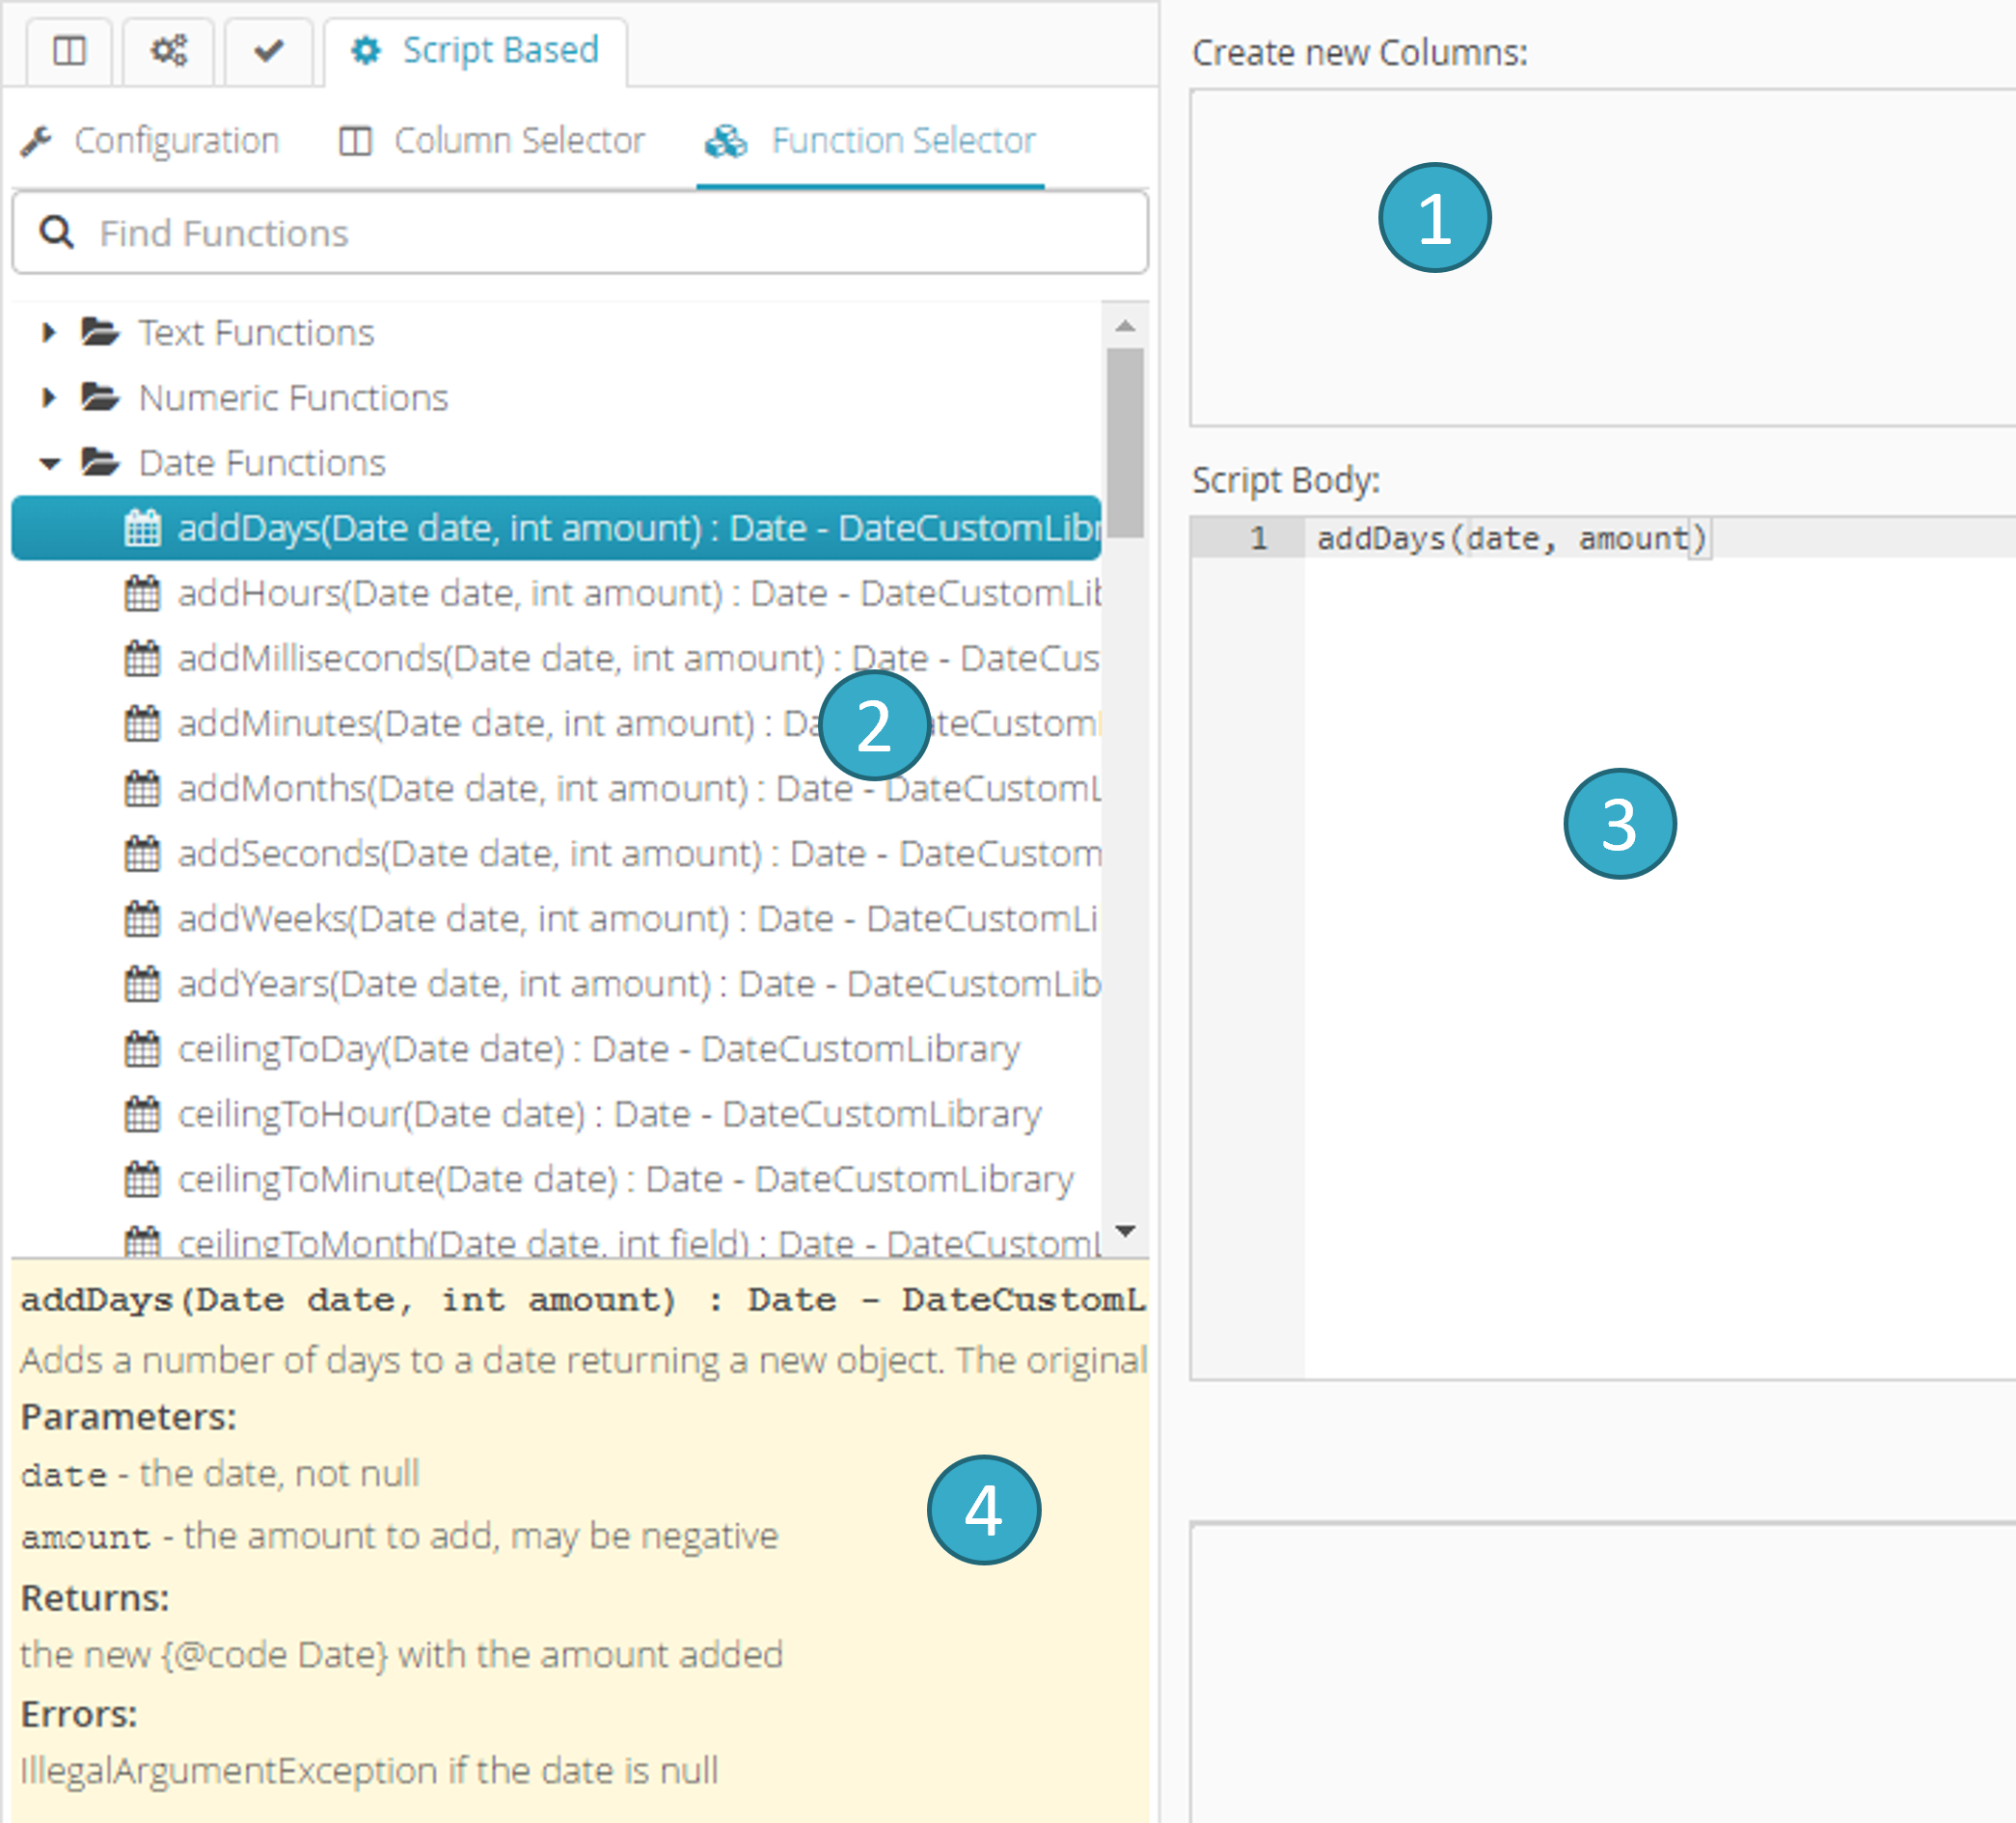
Select the Function Selector tab
.Double-click a function
.… to input the appropriate syntax into the script zone
.This zone offers help
with the selected function.
7.19.6.4. Syntax validation, Run preview and Run
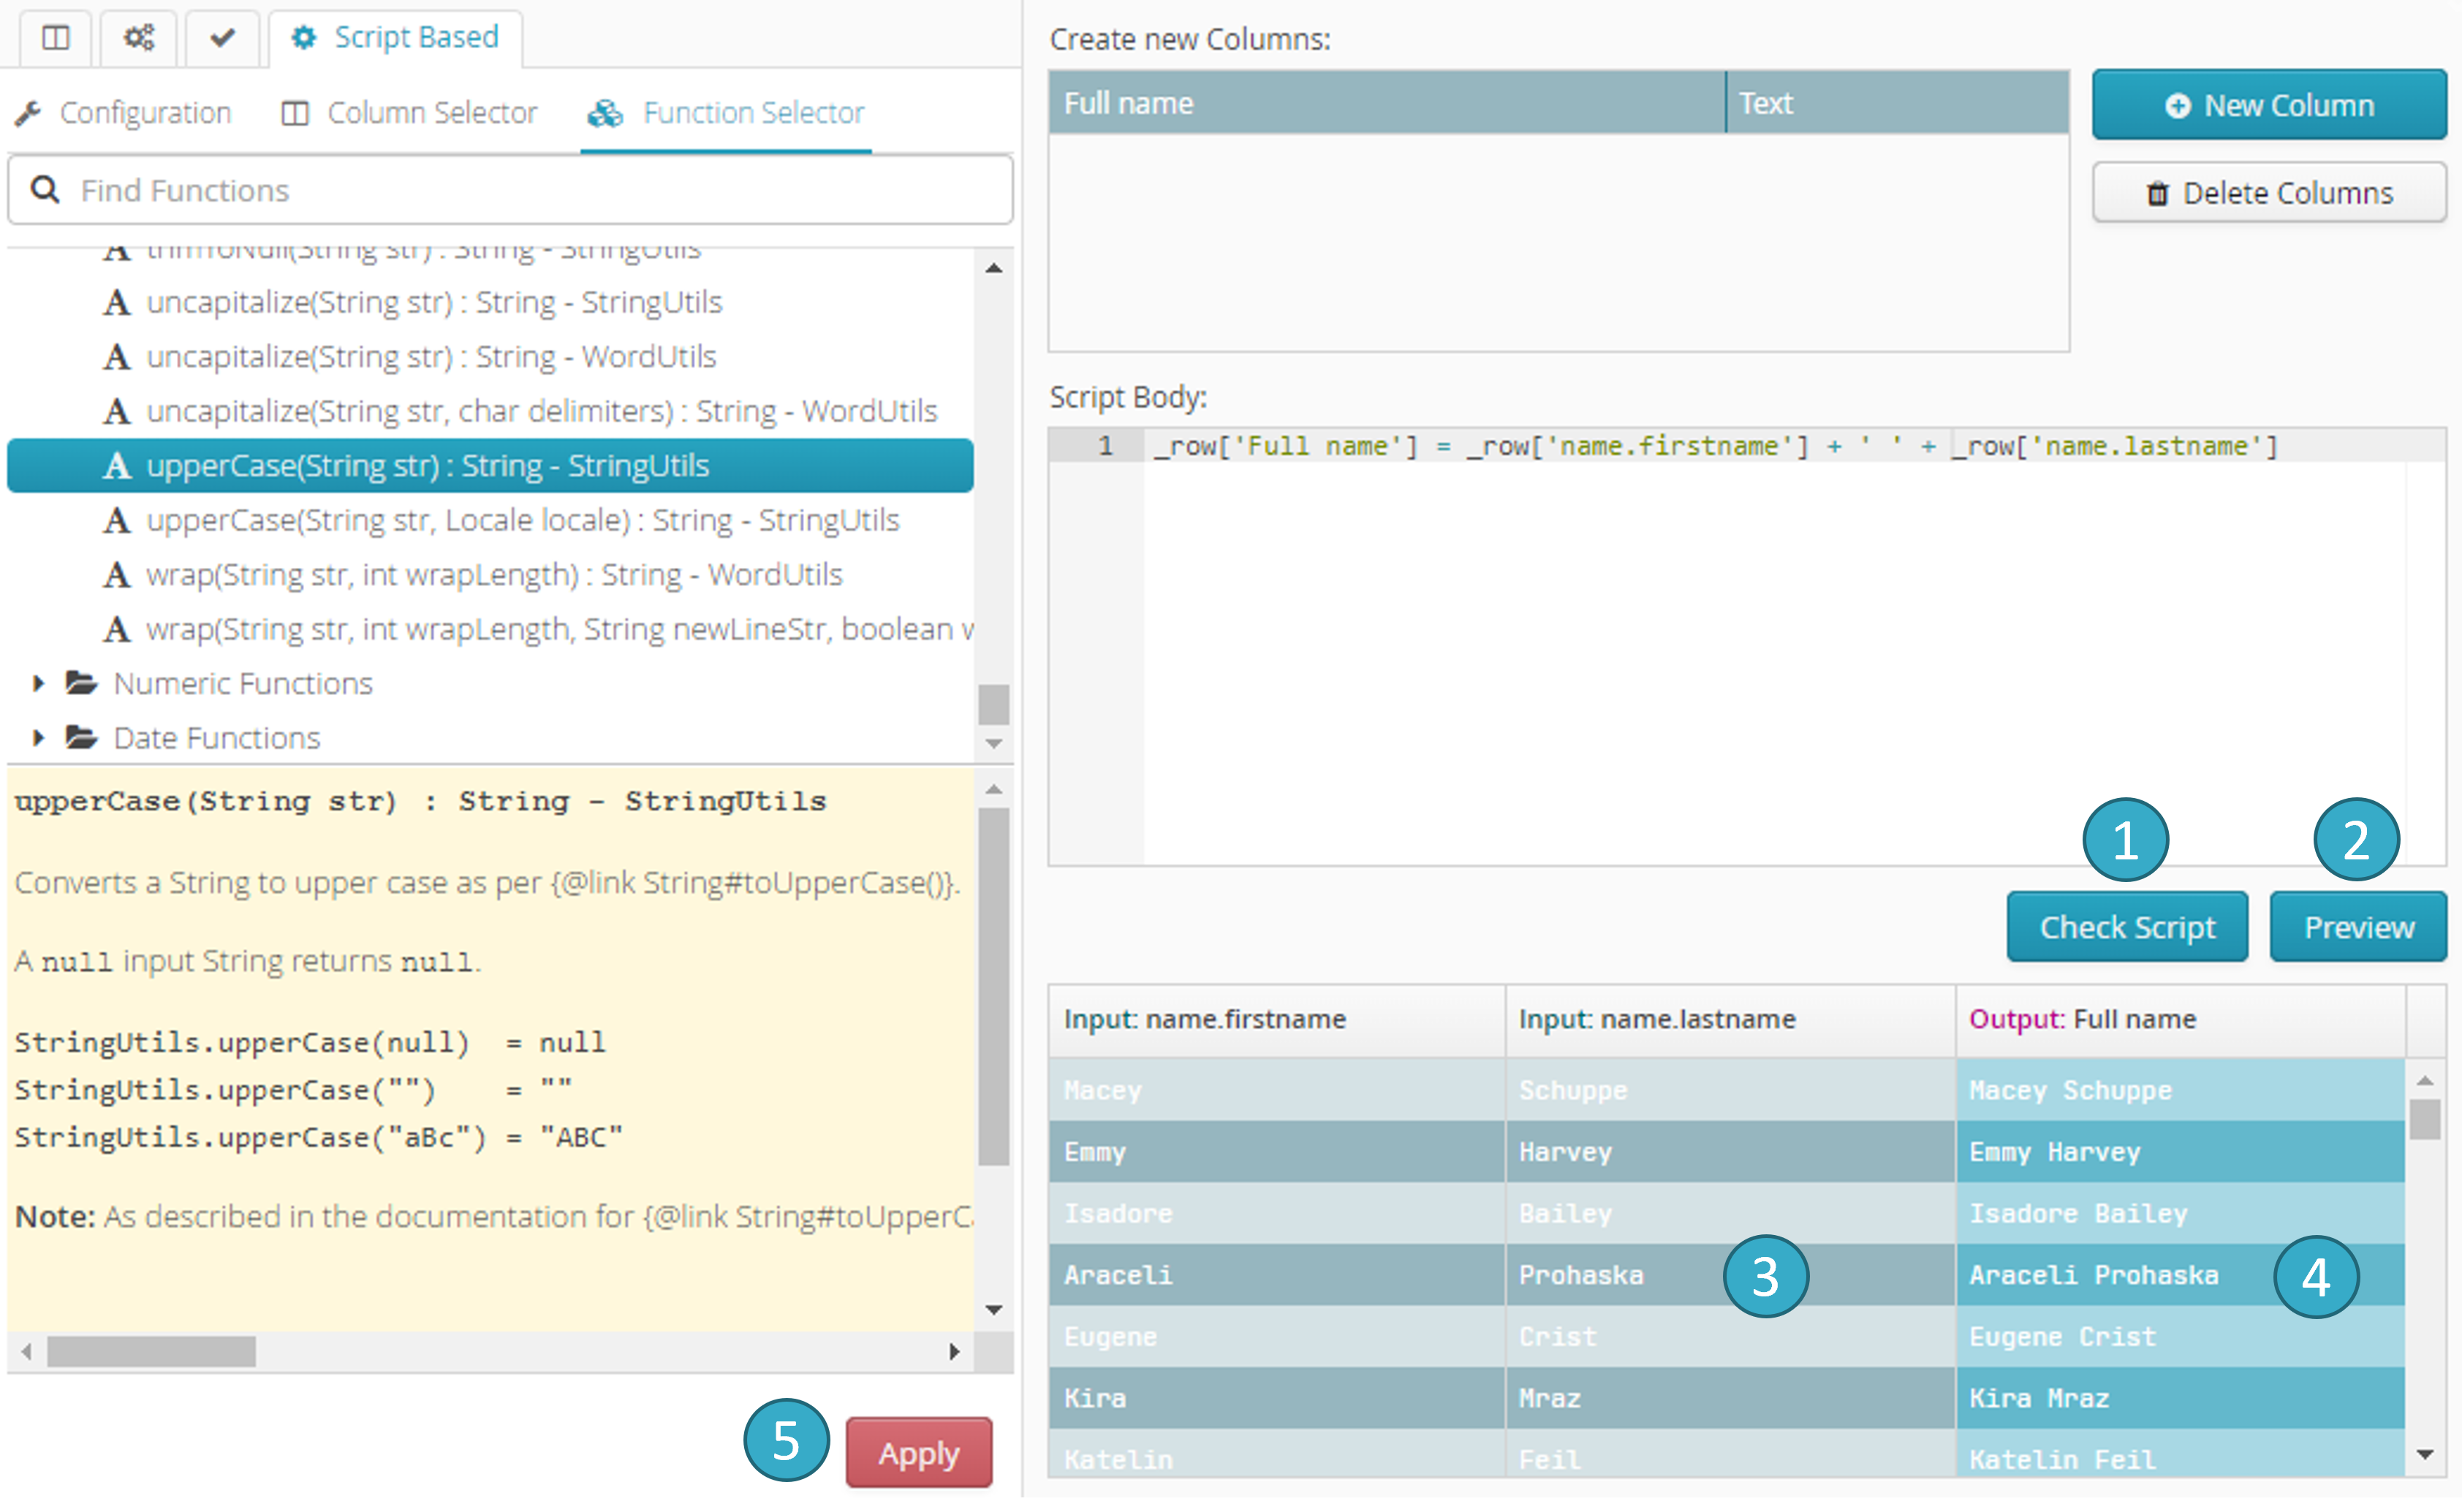
Click Check Script
to check that the syntax is valid (essential if you want to run the script).Click Preview
to preview script run (at this stage, script-type transformation has not yet been applied).The colored areas
 of the preview table show the fields with values read by the script.
The colored areas
 of the preview table show the fields with values changed by the script.
Appliquer
: applies the script to the dataset.
Visual Example:
The following script will create a field (C) and will allot to it the contents of fields A and B.
\_row['C'] = \_row['A'] + \_row['B'] ou bien \_row.C = \_row.A + \_row.C
The second syntax is only possible if field names contain no spaces.
_rowis a word used only to access an existing cell (in read or write mode).
The transformation will apply to one or more fields.
The transformation will use the active filter(s).
Note
Practical example : Script Based
Before Transformation:
ID |
Name |
Sales |
Region |
|---|---|---|---|
1 |
Alpha Co |
150 |
North |
2 |
Beta Inc |
200 |
South |
Transformation Configuration:
Name: “My great script”
Script Language:
GroovyComment: “This is a script to update sales amount according to the region.
Cancel on First Error: whether the transformation should fail on the first script execution error encountered. For example, division by zero.
New Columns: None
Script body:
if (record['Région'] == 'Nord') {
    record['Ventes'] *= 1.1;
}
After Transformation:
ID |
Name |
Sales |
Region |
|---|---|---|---|
1 |
Alpha Co |
165 |
North |
2 |
Beta Inc |
200 |
South |
In this example, the transformation applies a 10% increase in sales figures for records in the ‘North’ region, as specified by the Script Based script. The transformation leaves sales figures unchanged for other regions. This demonstrates how the transformation can selectively apply changes based on dataset attributes, enhancing the dataset according to business logic defined in the script.
7.19.7. Smart Select
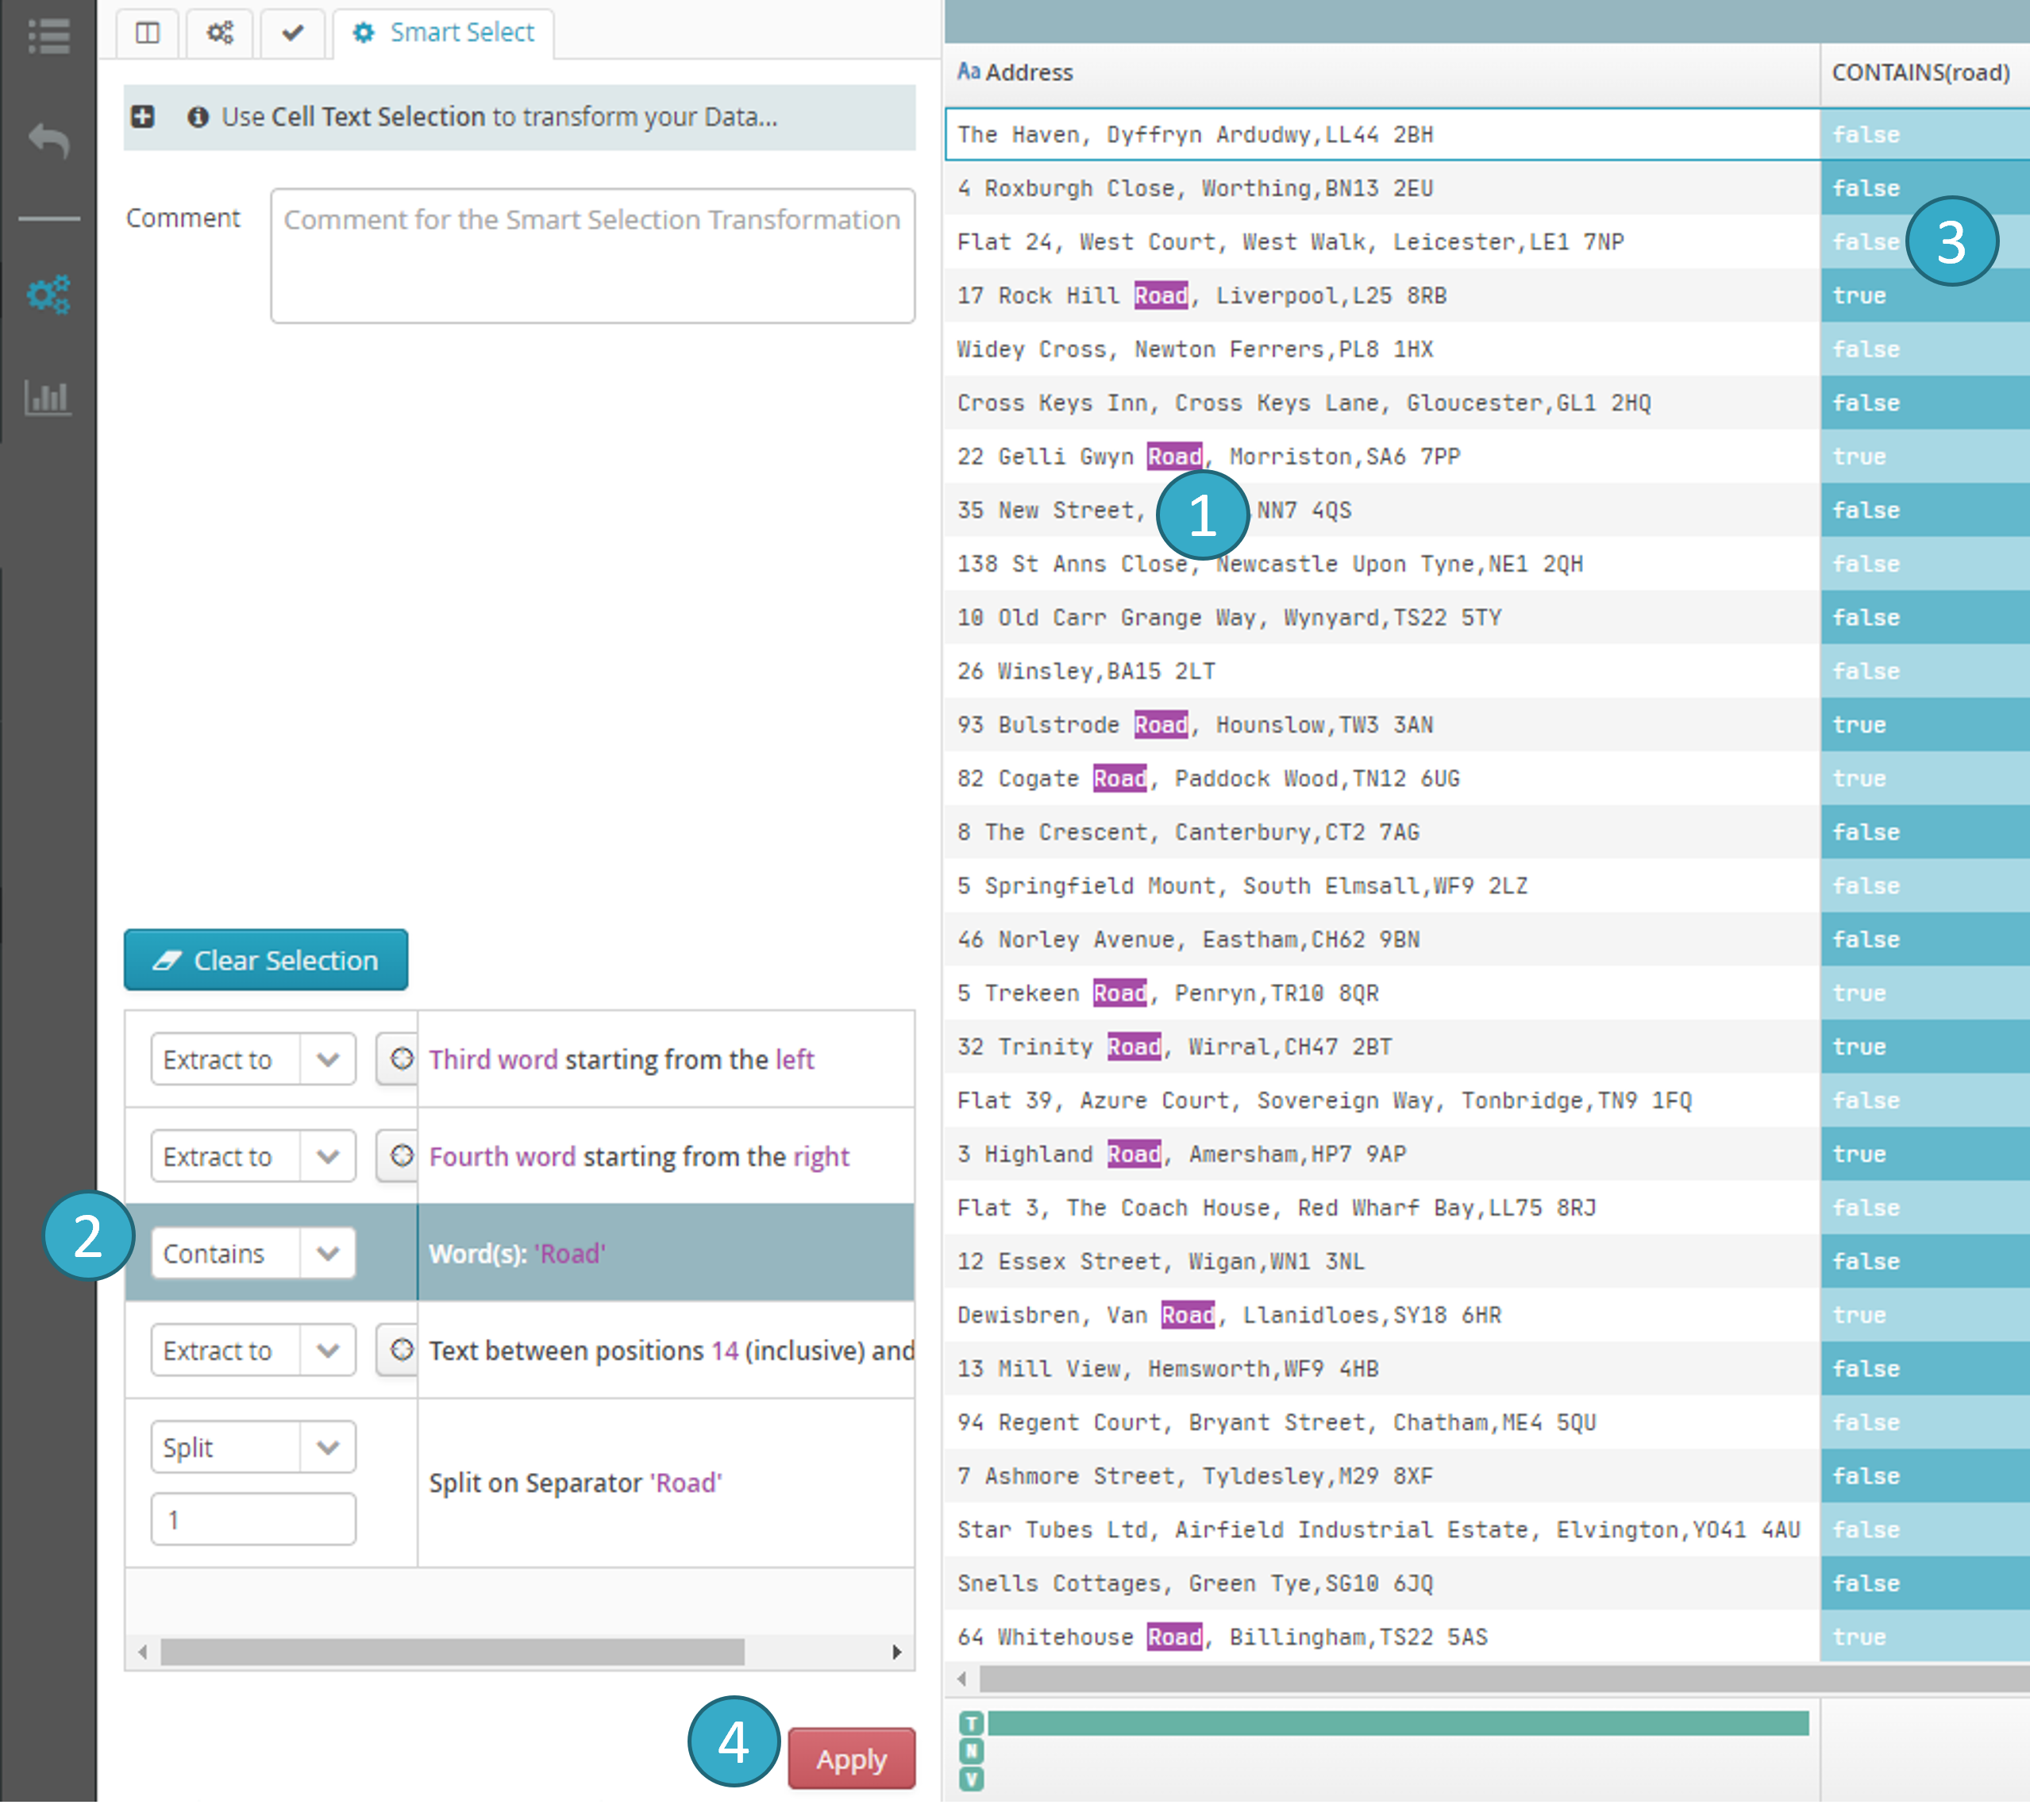
- Select a piece of text: click the cell you want (left button on the mouse, press and then release immediately). Then once the cell (and row) has been selected, drag the mouse, while keeping the left button pressed, over the text you want.
- Tale of Data will then offer several options based on the portion of the text that you have selected.
- One or more columns with a blue background will appear showing what the result of the transformation will be if you decide to apply it (preview).
Apply
: apply the selected transformation.
Also called Smart Selection, this functionality lets the system suggest one or more actions when you select all or part of the content of a cell.
Visual Example:
If you select the year in a date, the system will suggest extracting the number for the year and putting it into a new field.
If you select a character (e.g. ‘,’ or « ; », etc.), the system will suggest dividing the content of the cell into several different fields, separating them with the character(s) you have selected.
If you select a word in a sentence, the system will suggest creating a field that indicates whether the word is present in the cell (true/false).
The transformation will apply to just one field.
The transformation will use the active filter(s).
Note
Practical example : Smart Select
Before Transformation:
ID |
Name |
Status |
Revenu |
|---|---|---|---|
1 |
Alpha Co |
Active |
150000 |
2 |
Beta Inc |
Inactive |
90000 |
3 |
Gamma LLC |
Active |
200000 |
Transformation Configuration:
Selection: Select the text fragment ‘Active’ in the Status column.
Action: Accept the selection and request that the text fragment “Active” will be replaced by “Premium”.
After Transformation:
ID |
Name |
Status |
Revenu |
|---|---|---|---|
1 |
Alpha Co |
Premium |
150000 |
2 |
Beta Inc |
Inactive |
90000 |
3 |
Gamma LLC |
Premium |
200000 |
7.19.8. Add a Quality Indicator
Create a quality indicator based on several criteria: missing or invalid values, invalid rows (violations of column and/or row validation rules). You can find this transformation in the transformation search bar by typing the shortcut kpi
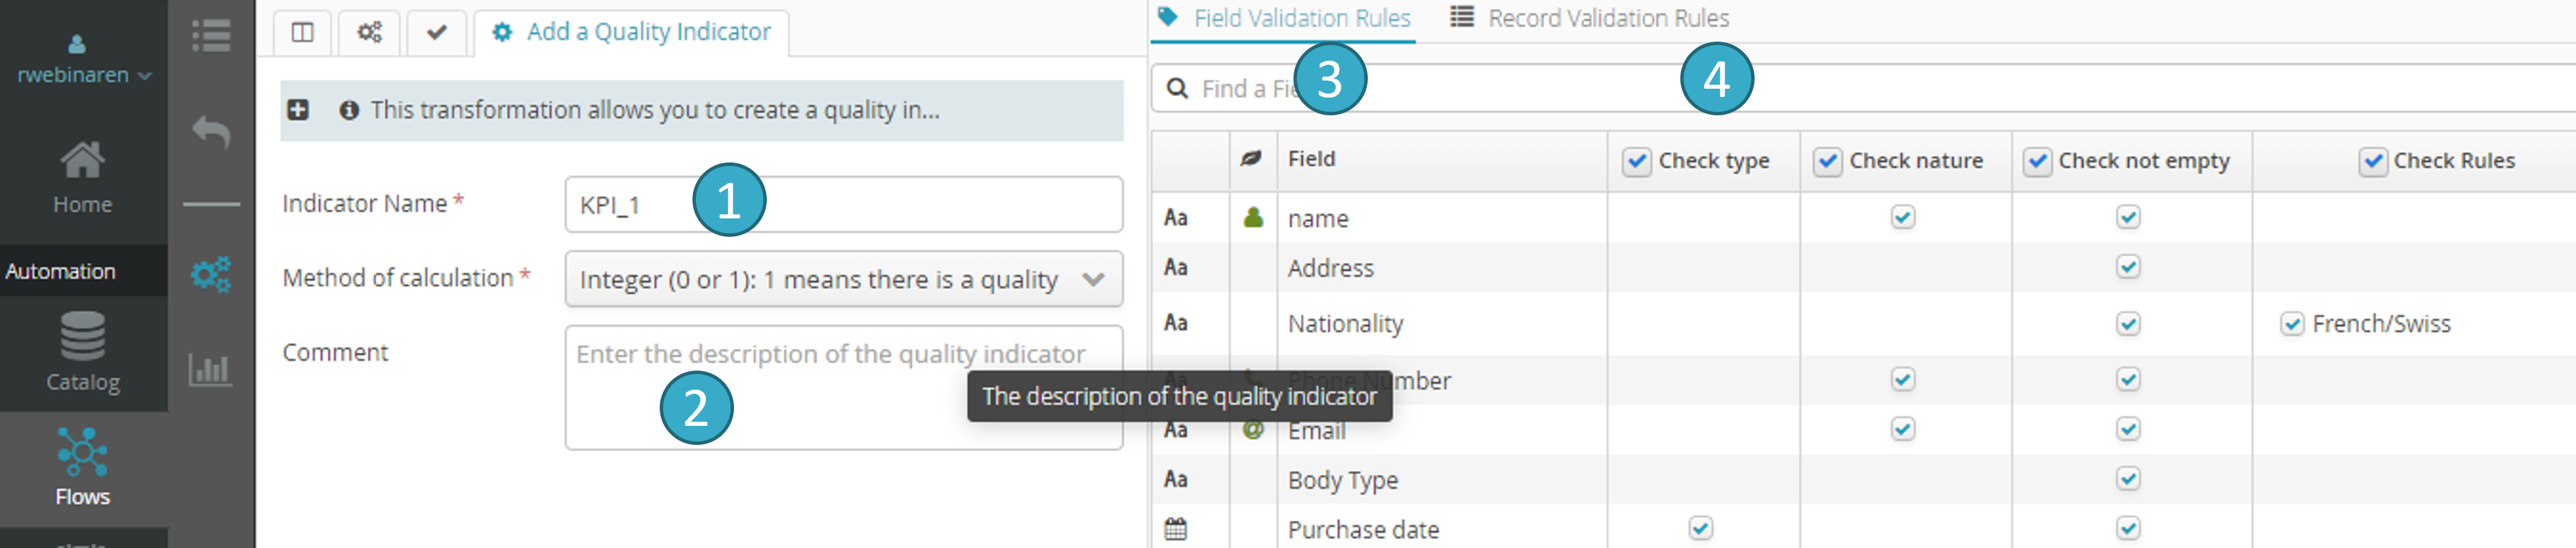
- Choose a name for the indicator.The name will be used to create the column(s) containing information on the quality of each record (row).
- Select an indicator calculation method. Six options will be offered:
Boolean: ‘true’ means there is a quality issue with the row (concerning the types of control specified in the table areas
and ).Boolean: ‘true’ means there are no quality issues.
Integer (0 or 1): 1 means there is a quality issue.
Integer (0 or 1): 1 means there are no quality issues.
Number of failed checks (0 means OK). the indicator value for each row will be the total number of control fails specified in the table areas
and .Number of failed checks by type of anomaly. Calculation is the same as above but in this case 5 columns (one per type of anomaly) will be added to the column total (that carries the name of the indicator) :
blank values
incorrect values (= type verification failure)
invalid form (e.g. invalid telephone or email)
values that violate a column validation rule
record that violates a row validation rule
Number of failed checks by column and type of anomaly. Calculation is the same as above but in this case, the result is sorted per column:
blank values
incorrect values (= type verification failure)
invalid form (e.g. invalid telephone or email)
values that violate a column validation rule
record that violates a row validation rule
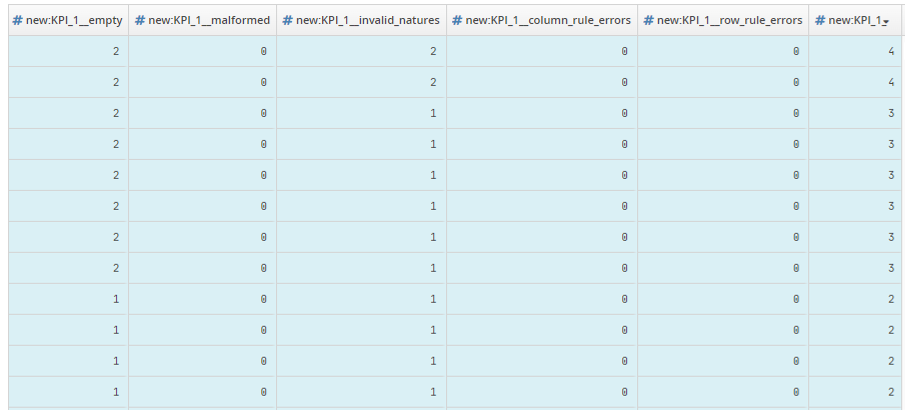
Number of control fails per type of anomaly calculation method: six additional columns. Five columns will be prefixed with the indicator name (KPI_1_XXX). The column bearing the name of the indicator will contain the total number of anomalies for a given row.
Two types of control can be used to calculate the quality indicator:
Control by field (Field Validation Rules tab
Type:
in a date field, for example, all cells containing a value that is not recognized as a valid date will be treated as incorrect during indicator calculation.
Nature:
in a field identified as containing emails, for example, all cells containing a value that is not recognized as a valid email will be treated as incorrect during indicator calculation.
Presence:
all cells that do not contain a value will be treated as incorrect during indicator calculation.
- Field validation rules will be controlled in an upstream preparation node.
All cells in the specified field that contain a value that is invalid in rule terms (e.g. list of permitted values or validity interval) will be treated as incorrect during indicator calculation.
Control by record (Record Validation Rules tab
Note
Practical example : Add a Quality Indicator
Before Transformation:
ID |
Name |
Age |
|
|---|---|---|---|
1 |
Alice |
30 |
|
2 |
Bob |
bob@website.combob@website.com |
|
3 |
Charlie |
25 |
N/A |
Transformation Configuration:
Indicator Name: “MyKPI”
Quality Checks:
Check for blank fields
Validate data types
Ensure data nature accuracy
Indicator Calculation Method:
Number of control fails per type of anomaly
After Transformation:
ID |
Name |
Age |
MyKPI__empty |
MyKPI__malformed |
MyKPI_invalid_natures |
MyKPI |
|
|---|---|---|---|---|---|---|---|
1 |
Alice |
30 |
0 |
0 |
0 |
0 |
|
2 |
1 |
1 |
1 |
3 |
|||
3 |
Charlie |
25 |
0 |
0 |
1 |
1 |
In this example, the transformation has added four new columns:
MyKPI_Empty: total number of missing values for current row.MyKPI__malformed: total number of Type Recognition Errors for current row.MyKPI_invalid_natures: total number of Nature Recognition Errors for current row.MyKPI: errors grand total for current row. Explanation for the second row (Bob):
Explanation for line 2 (Bob):
Bob’s name is missing, so the value for column
MyKPI__emptyis 1Bob’s age is malformed (aka type recognition error). The value is a dash instead of a number: so the value for column
MyKPI__malformedis 1Bob’s email is invalid (nature recognition error). Bob@xx is not a valid email, so the value for column
MyKPI__invalid_naturesis 1The error grand total (
myKPIcolumn) for Bob is then 1 + 1 + 1 = 3