8.3. Calculated fields tab
The window function is useful because it lets you perform calculations on the window with results displayed in the current record in additional fields (one field added per calculation).
You can add a prefix to the names of all the fields calculated by the window function (Prefix field in the configurator).
There are two sorts of calculation function:
8.3.1. Calculation of the position of each row in the window
Caution
Position calculations cannot be performed unless the window has been sorted (at least one sort field must be specified)
Rank
The Rank function sets how the window records are to be ordered (1er, 2ème, 3ème…etc.).
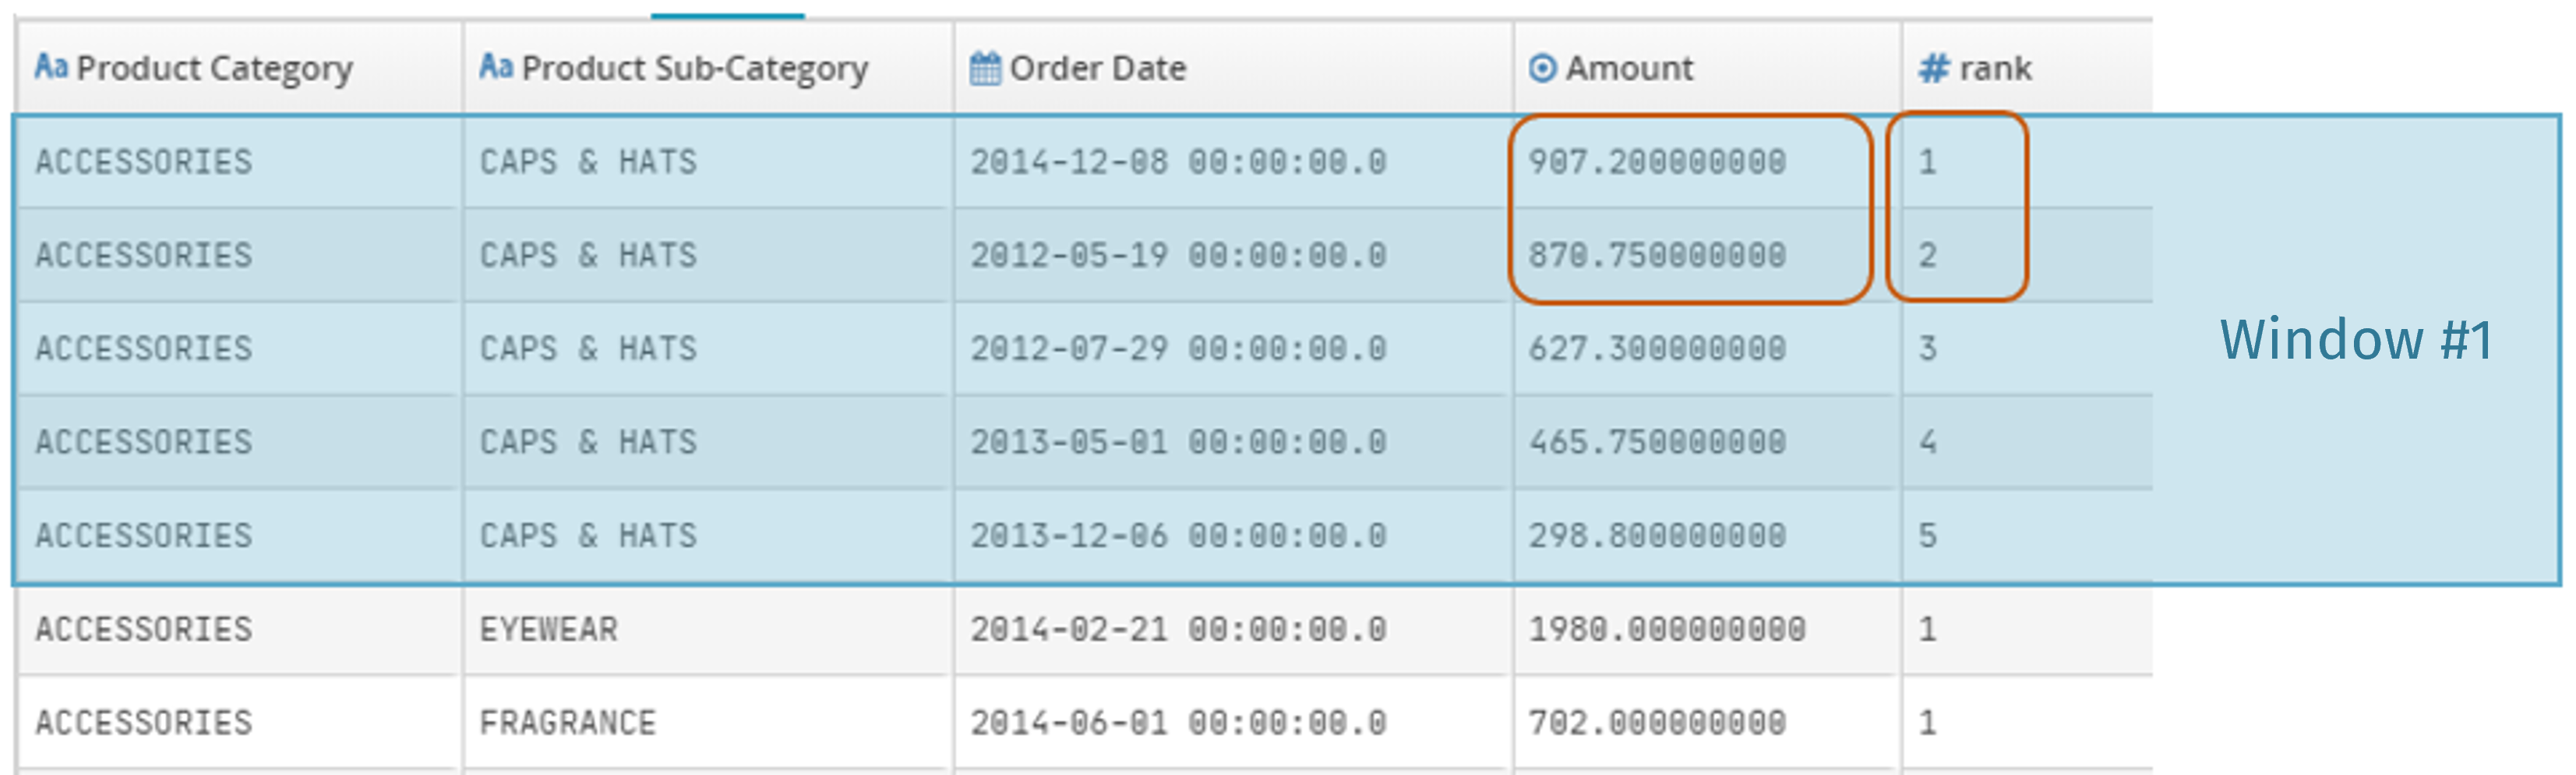
In the following example:
Frame boundaries are set by partitioning into Product Category and Product Sub-Category fields.
The configured sort is shown in decreasing order in the Amount field.
Rank shows that the second largest purchase in the ACCESSORIES > CAPS & HATS category was made on 19 May 2012 for 870.75.
Note
If two records are both ranked first, then the next record will be ranked third.
Dense Rank
The Dense Rank function mirrors the Rank function but does not allow jumps. Therefore, if 2 records are both ranked first, the next record will be ranked second.
Row number
Consecutive numbering starting at 1 for each record in the window (1, 2, 3 etc.).
8.3.2. Aggregation functions
These functions are similar to cube (Pivot) measures, except that for each current record the calculation is based on the window around the current record. This enables calculation of e.g. moving averages and cumulative sums.
Caution
The operation is suggested only for compatible field types, e.g. sums can only be calculated for numerical fields.
Example 1
Identification of the biggest customers of the day per store.
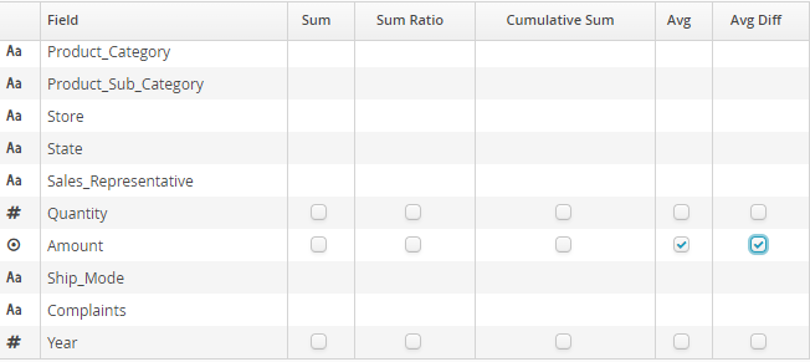
Frame boundaries are set by partitioning the Store field.
The configured sort is shown in decreasing order by Amount (total purchase).
Selected aggregation functions are Avg and Avg Diff in the Amount field:
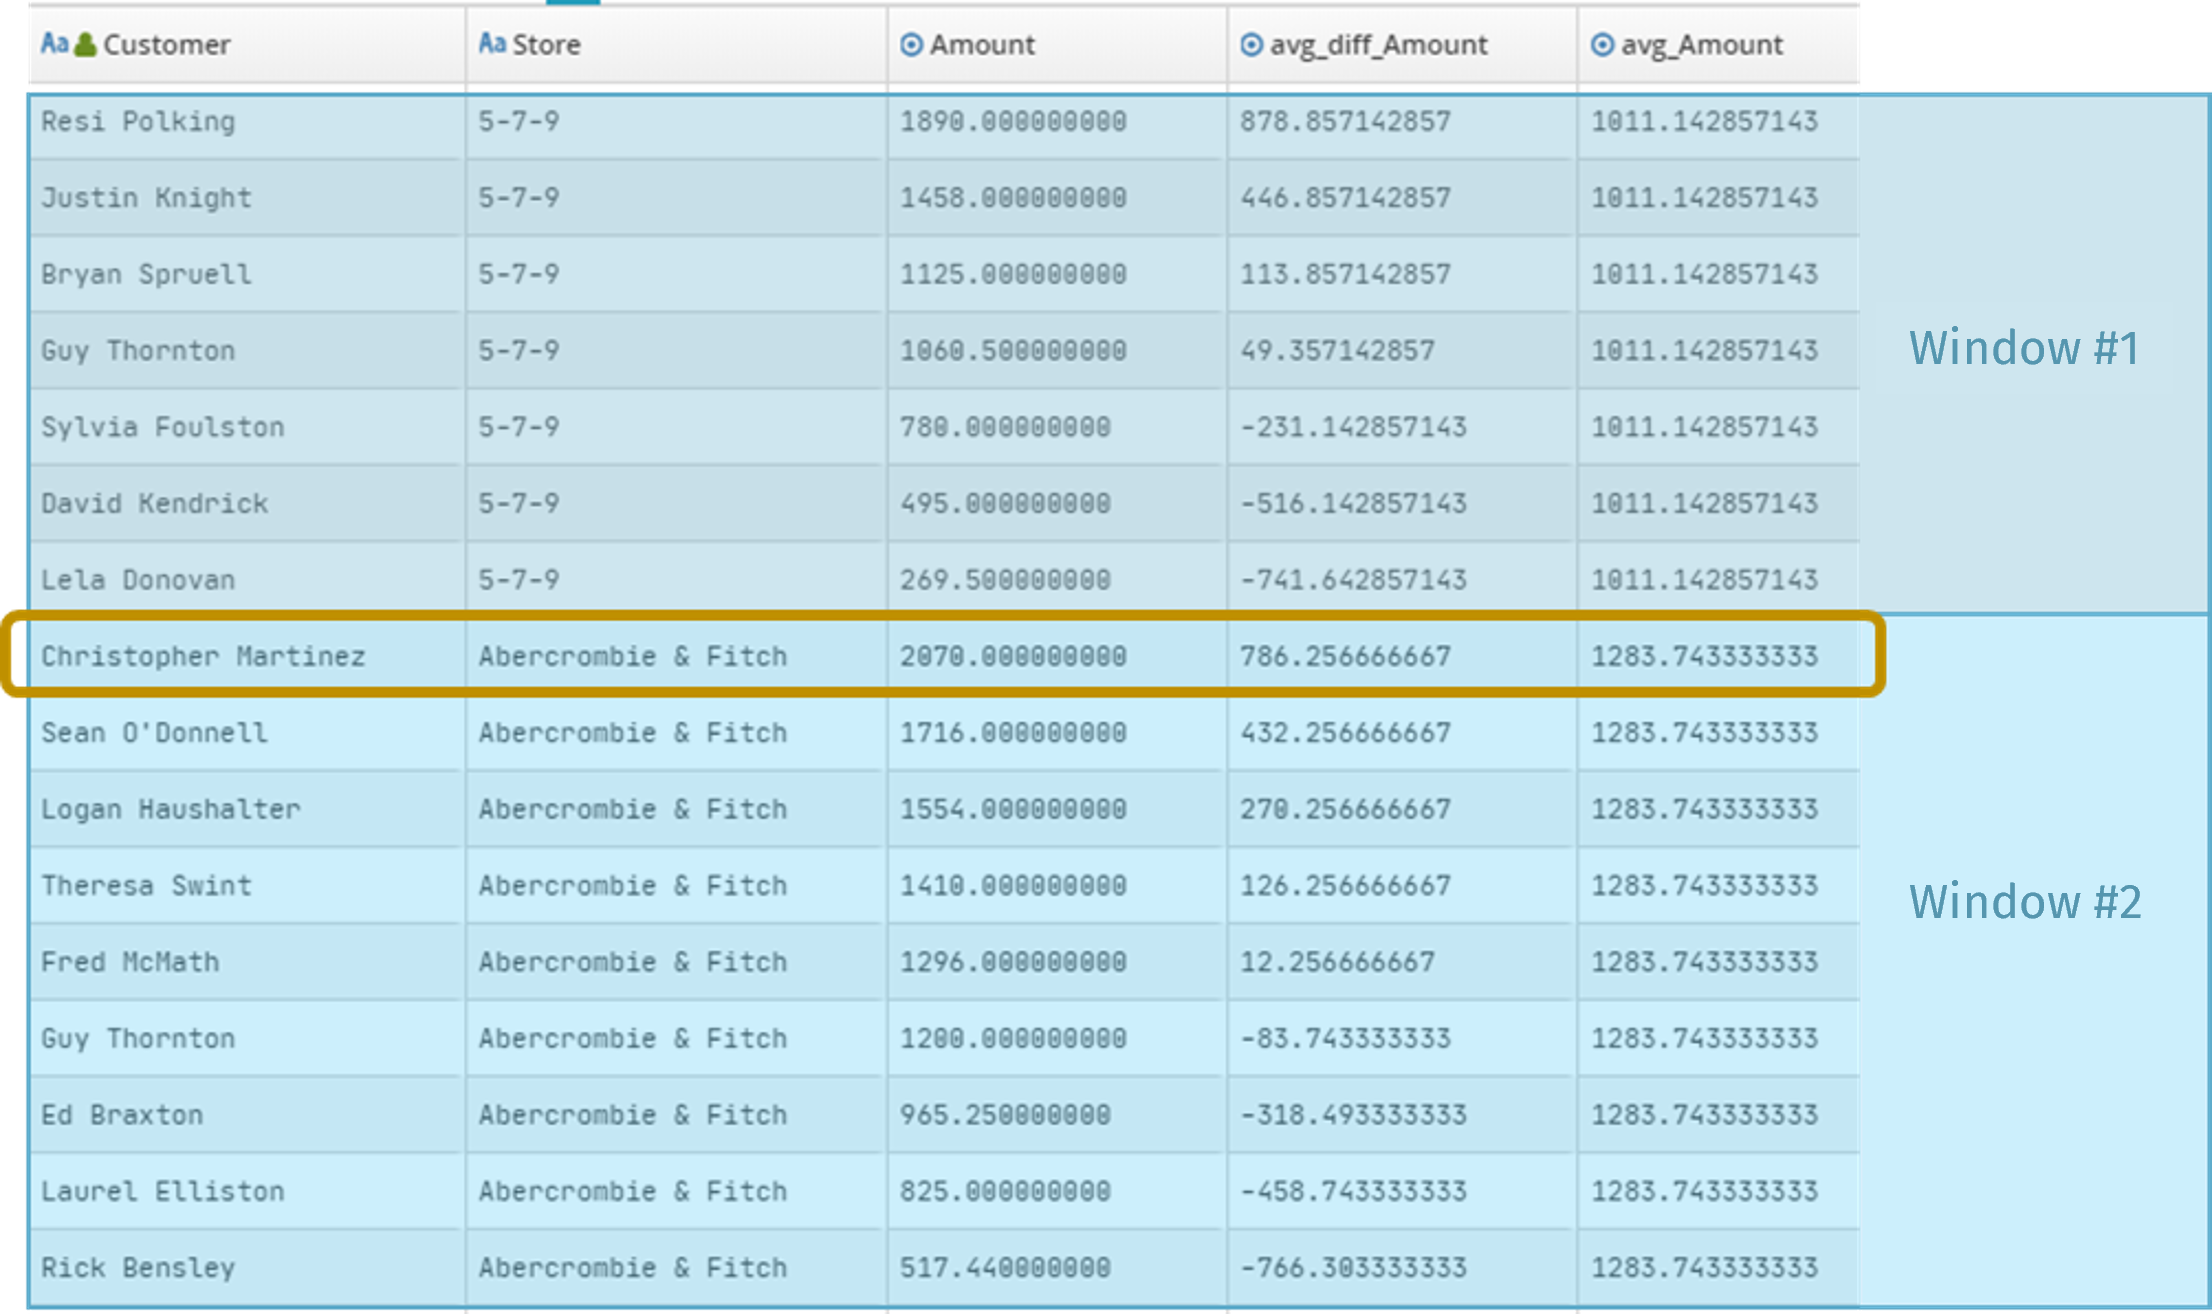
The chart below shows that:
Christopher Martinez was the day’s biggest customer at Abercrombie & Fitch.
His €2070 purchase was €786.25 above Abercrombie & Fitch’s average basket that day. His average basked was €1283.74.
Example 2
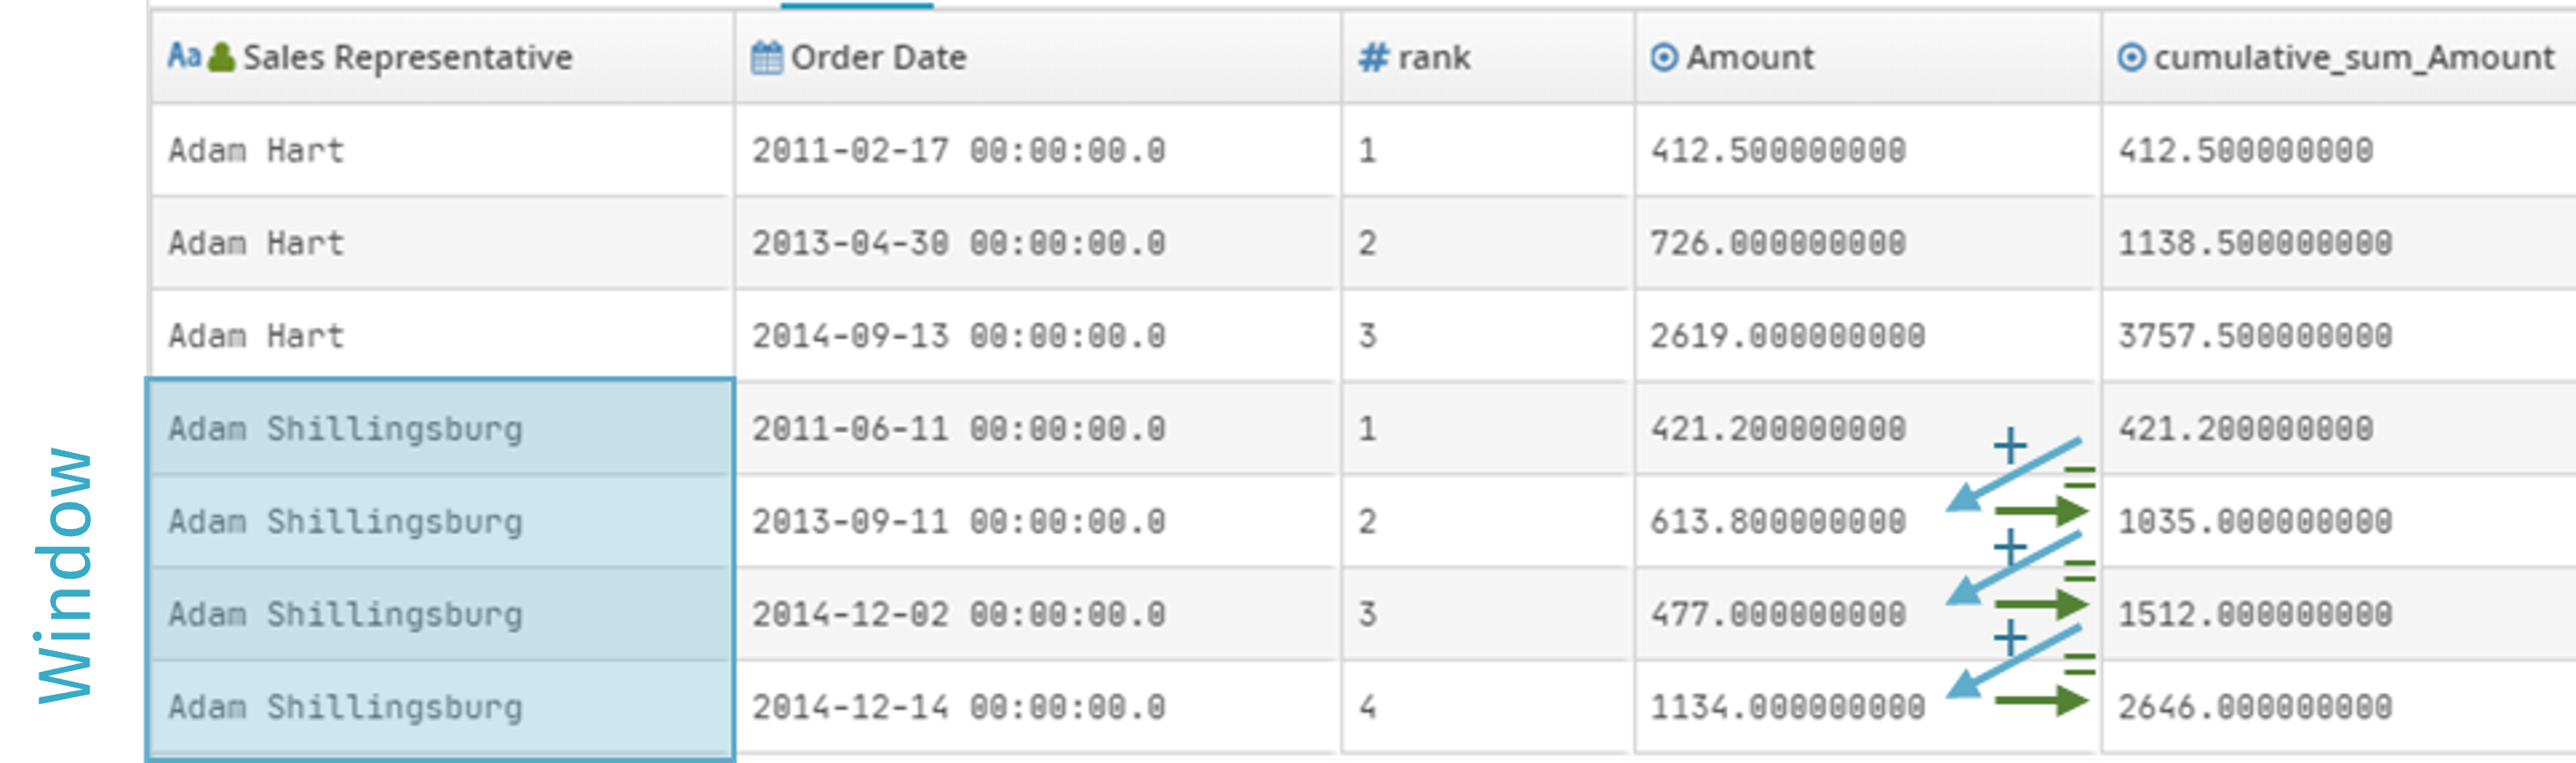
Performance of sales representatives:
Frame boundaries are set by partitioning the Sales Representative field.
The configured sort is shown in increasing order by Order Date.
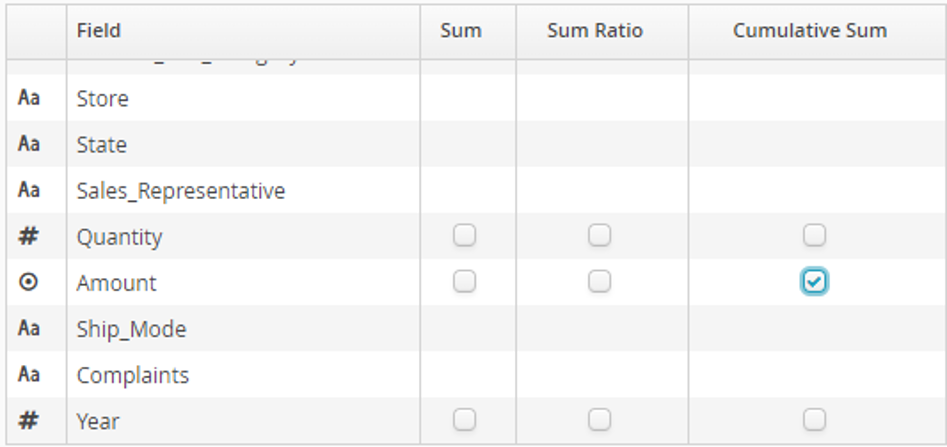
The selected aggregation function is Cumulative Sum in the Amount field:
The chart below shows the cumulative sum (by increasing order date) of the sales made by Adam Shillingsburg:
The following aggregation functions are available:
- Sum
total values of a numerical field in the current window..
- Sum Ratio
value of the current record for the selected numerical field as a proportion of the total values of the current window for that same field.
- Cumulative Sum
cumulative sum for the window of the values in a numerical field (requires a sort column).
- Average
average of the values in a numerical field in the current window.
- Average Diff
difference between the value of the current record for the selected numerical field and the average value of that same field in the current window (this tells you, for example, how much the value of a particular purchase made by a particular customer is above/below his/her average purchase over the week, if the window is a rolling week).
- Count
breakdown of the number of separate values of a field in the current window..
- Standard Deviation
standard deviation of the values of a numerical field in the current window.
- Min
minimum value of a field in the current window.
- Max
maximum value of a field in the current window.
- First
first value of a field in the current window.
- Last
last value of a field in the current window.
- Lag
cell value that is above the current record for the selected field.
- Lag Diff
difference from the cell value that is above the current record for the selected field (can be very useful when comparing values for time-related events to identify up/down trends). This function applies only to continuous (i.e. date or numerical) fields.
- Lead
cell value that is below the current record for the selected field.
- Lead Diff
difference from the cell value that is below the current record for the selected field. This function applies only to continuous (i.e. date or numerical) fields.
- Concat With Comma
combine all cells with text values, separating values with a comma.
- Concat with Pipe
combine all cells with text values, separating values with a pipe (|).