12.1. View of analyses
The list of analyses is found in the Mass Data Discovery section of Tale of Data, in the first entry of the submenu, within the first tab.
To create a new analysis, click on New Analysis at the top right. The next section details the configuration of the new analysis.
To modify an existing analysis, use the small pencil on the line corresponding to it.
To run an analysis, simply create it and click on the Run Now button in the configuration window, once the analysis is well configured. If the analysis has already been configured, it can be started directly using the “play” button next to the small pencil.
Warning
It is not possible to run the same MDD scan at the same time.
12.2. Configuration of an analysis
12.2.1. General settings
The general parameters first allow you to define a name, a description, and a group for the analysis.
12.2.2. Data sources
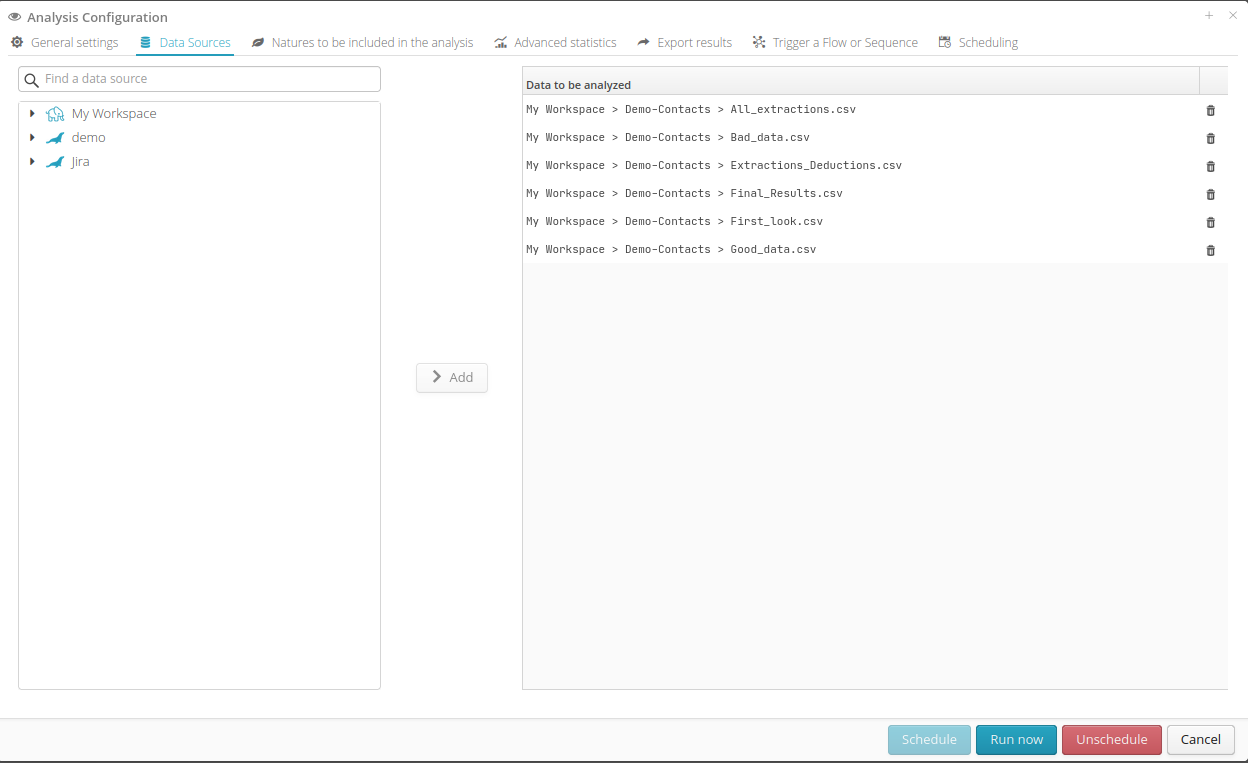
In the data sources tab, it is possible to simultaneously select multiple sources from the user’s catalog of available sources. Hierarchies within the sources can be expanded to pick a group of tables, a single table, or individual files. This way, Tale of Data offers great flexibility in defining the systems to analyze, allowing each analysis to focus on datasets that vary significantly in number and complexity.
12.2.3. Natures
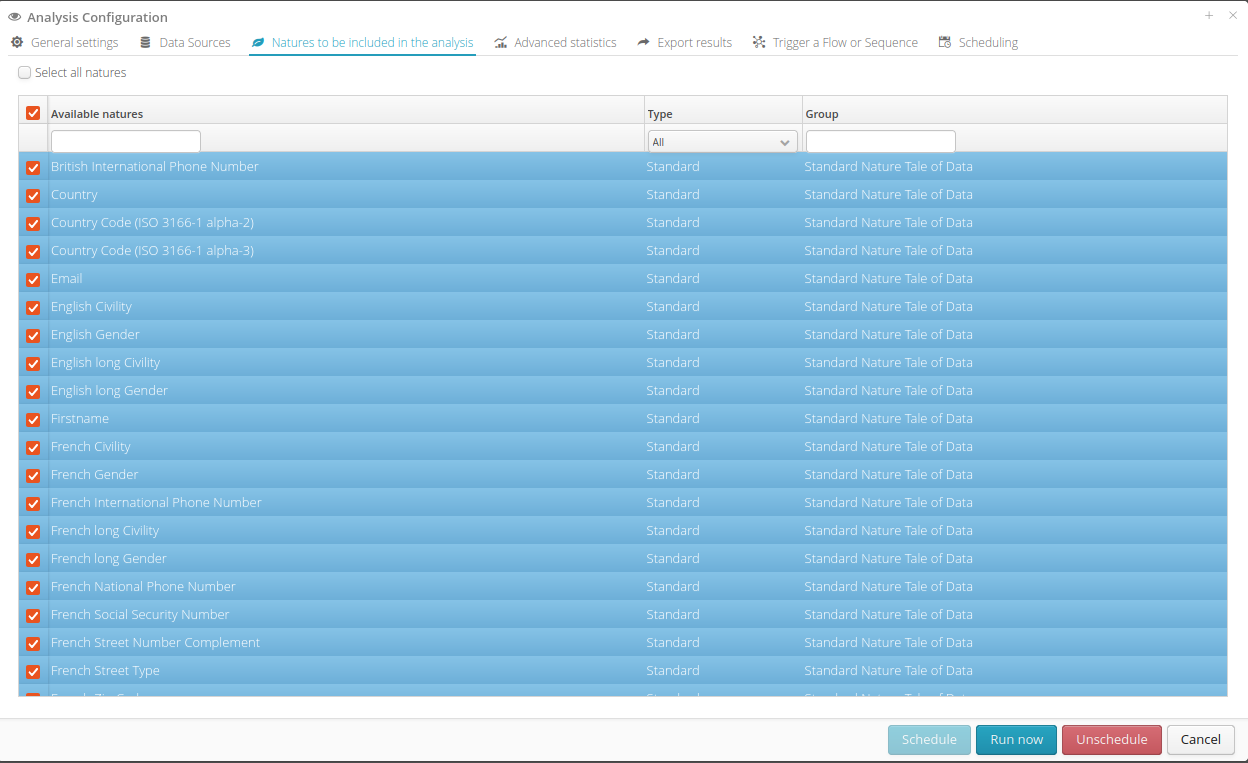
The Natures tab allows you to specifically select natures of data that will be identified during the analysis. At least one nature must be selected.
12.2.4. Advanced statistics
It is optionally possible to enable the calculation of advanced statistics. This calculation will create a load on the server providing the data and should not be used if the results are not useful to the user, as it slows down and adds weight to the analysis. The generated statistics can be extremely useful for characterizing datasets on a large scale.
The collected statistics are :
- count_distinct
Count of distinct values in the column
- mean
Calculation of the average value for numeric columns
- stddev
Calculation of the standard deviation (variation or dispersion) of values for numeric columns
- min
Minimum value of the column
- percentile_5
Calculation of the 5th percentile for numeric columns, below which 5% of observations fall
- percentile_25
Calculation of the 25th percentile for numeric columns, below which 25% of observations fall
- percentile_50
Calculation of the 50th percentile for numeric columns, below which 50% of observations fall
- percentile_75
Calculation of the 75th percentile for numeric columns, below which 75% of observations fall
- percentile_95
Calculation of the 95th percentile for numeric columns, below which 95% of observations fall
- max
Maximum value of the column
Regarding the calculation of distinct values, two options are available :
An estimation-based calculation of the number of distinct values
An exact measurement of these distinct values
These statistics will be accessible after the analysis in two ways :
In the “anomaly mapping” section, in a Advanced Statistics section.
Within the raw exported analysis data, if the option has been enabled.
12.2.5. Export of results
This tab allows you to export the raw results into a table at the end of the analysis. If the target is a database, it will be possible to directly specify the table. If the target is a file system (such as “my workspace,” for example), you will need to specify a CSV or Parquet format.
Two writing modes are available :
Append data to the end of the target table (Results are added after aggregating the source data to form a single table).
Overwrite the data in the target table (Results replace existing data to create a new table).
When an export target has been configured, it will be mentioned at the bottom right of the panel as shown in the screenshot below.
12.2.6. Flow or sequence of flows to trigger at the end of the analysis
In this tab, it is possible to select existing flows or sequences of flows that can be automatically triggered at the end of the analysis to automate certain tasks (for example, prepare data from the obtained results).
12.2.7. Scheduling
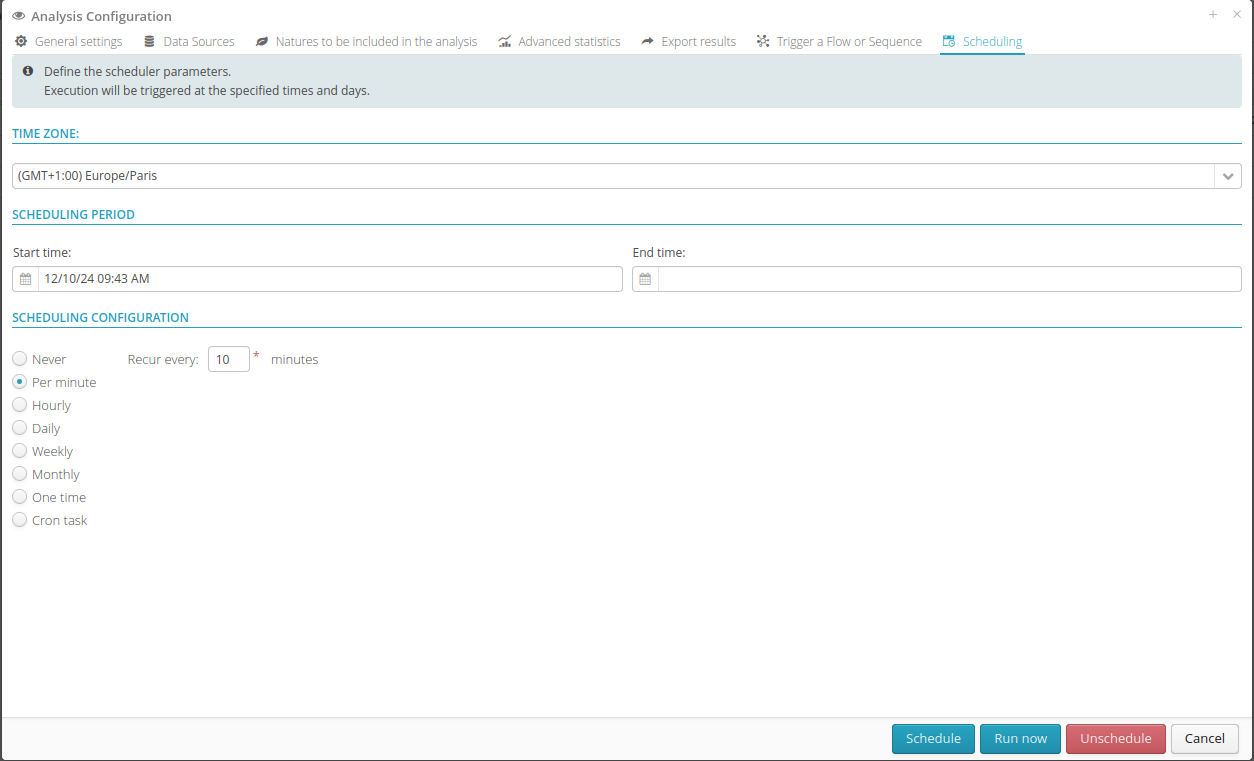
In addition to the previous tab, it is also possible to automate a created analysis. Simply define the execution frequency directly in this tab.
Hint
The repetition frequency must be at least 10 minutes.
12.3. View of executions
When an analysis is launched, the Mass Data Discovery will scan all the datasets from the selected data sources. This is to perform inference for data types when necessary (for example, for CSV files) as well as inference of the natures (emails, phones, etc.).
All executions, whether launched, in progress, interrupted, or completed, will be visible in the Analysis Executions table. Once the execution is complete, the results can be viewed by clicking the Open button, as shown below.
12.3.1. Stopping and resuming executions
A launched execution can be stopped at any time by pressing the red square button Stop Analysis.
It is possible to restart it at any time by pressing the orange button Resume Analysis.
During the execution of an analysis, it is possible that some tables may present read errors. This can occur, for example, if in the table concerned:
there are formatting issues, or
some columns of the table are not readable by Tale of Data, or
the connection does not allow access to this table (read forbidden)
If this occurs, the MDD analysis will continue, and an error report listing the tables that failed to scan, along with the reason for each, will be immediately available for download, alongside the results that could be calculated.
12.4. Custom Nature Configuration
In Tale of Data, it is possible to extend the platform’s capabilities to detect and verify the quality of your own business objects, in addition to the standard supported types (such as phone numbers, IBANs, first names, etc.). These custom natures will be used throughout the platform, both in Mass Data Discovery and in Flows, particularly in the preparation editor and with the validation node.
In this tab, you can define custom natures that will then be detected when running an analysis.
12.4.1. Nature type
A custom nature can be defined using one of the following three approaches:
Regular Expression: Specify the regular expression used to detect data of the current nature being edited.
List of values: Using a dictionary containing up to 20,000 possible values.
Java Method: Must return a Boolean value and have only one implicit, non-null, non-empty parameter of type String named value (where value is the cell value whose nature you want to verify).
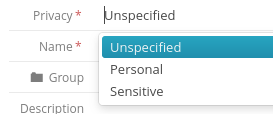
It is also possible to configure the privacy of the custom nature. For example:
Sensitive: Indicates that this nature will be identified as GDPR data.
Non-sensitive: Indicates that this nature will not be identified as GDPR data.
Unspecified: Indicates that the nature will be treated as having unspecified privacy.


