12.4. Exploitation of the results of an analysis
12.4.1. Different ways to make use of the results
Once an analysis has been configured, launched, and completed, the goal will be to make good use of the results.
This can be done in several different ways:
with the raw data that will have been exported (see section here for export configuration), it will be possible:
to work on its results using flows and/or dashboards, whether with a manual launch of flows or sequences of flows later, at the users’ convenience, or by scheduling the execution of a flow or a sequence of flows automatically as soon as the analysis is complete.
To integrate the data into other tools (e.g., third-party Data Catalog, MDM, …) by using it as a product to use for information exchange and enrichment with other systems. The raw data can be written into any system present in the catalog, enabling for easy retrieval by third-party systems, which will then enrich the other tools with highly relevant quality metadata information.
Note
For more information on the structure of the raw data generated when export is enabled, see the corresponding section.
with the graphical user interface, it is possible to accomplish the following tasks:
to visualize the analysis results, at the scale of a complete data source from the catalog, or a group of tables for databases, or a particular folder for file systems, or a specific table (drill-down).
to visually observe the evolution of the data mass over time, by looking at the evolution of analysis results for the selected system.
to export the analysis results for the selected system into a PDF descriptive sheet or an Excel workbook.
to observe advanced statistics for the selected table, if there are analysis results for which their calculation has been requested.
We begin in the following sections with a description of the use of the graphical interface for visualizing results.
12.4.2. Global Statistics
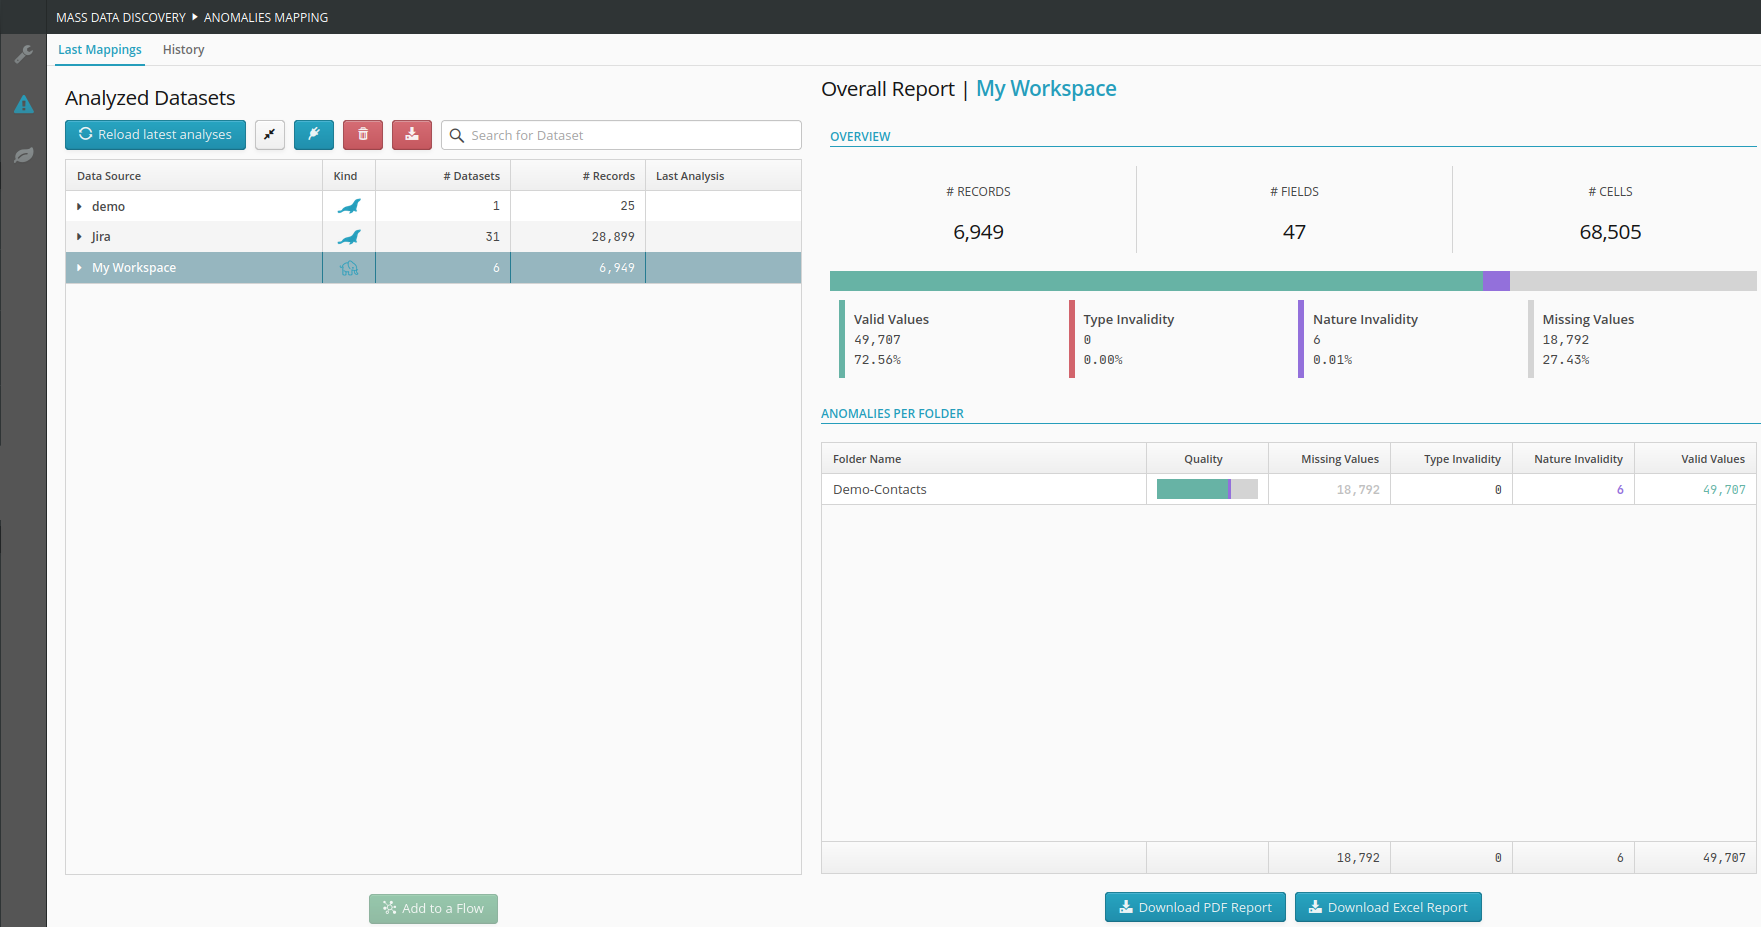
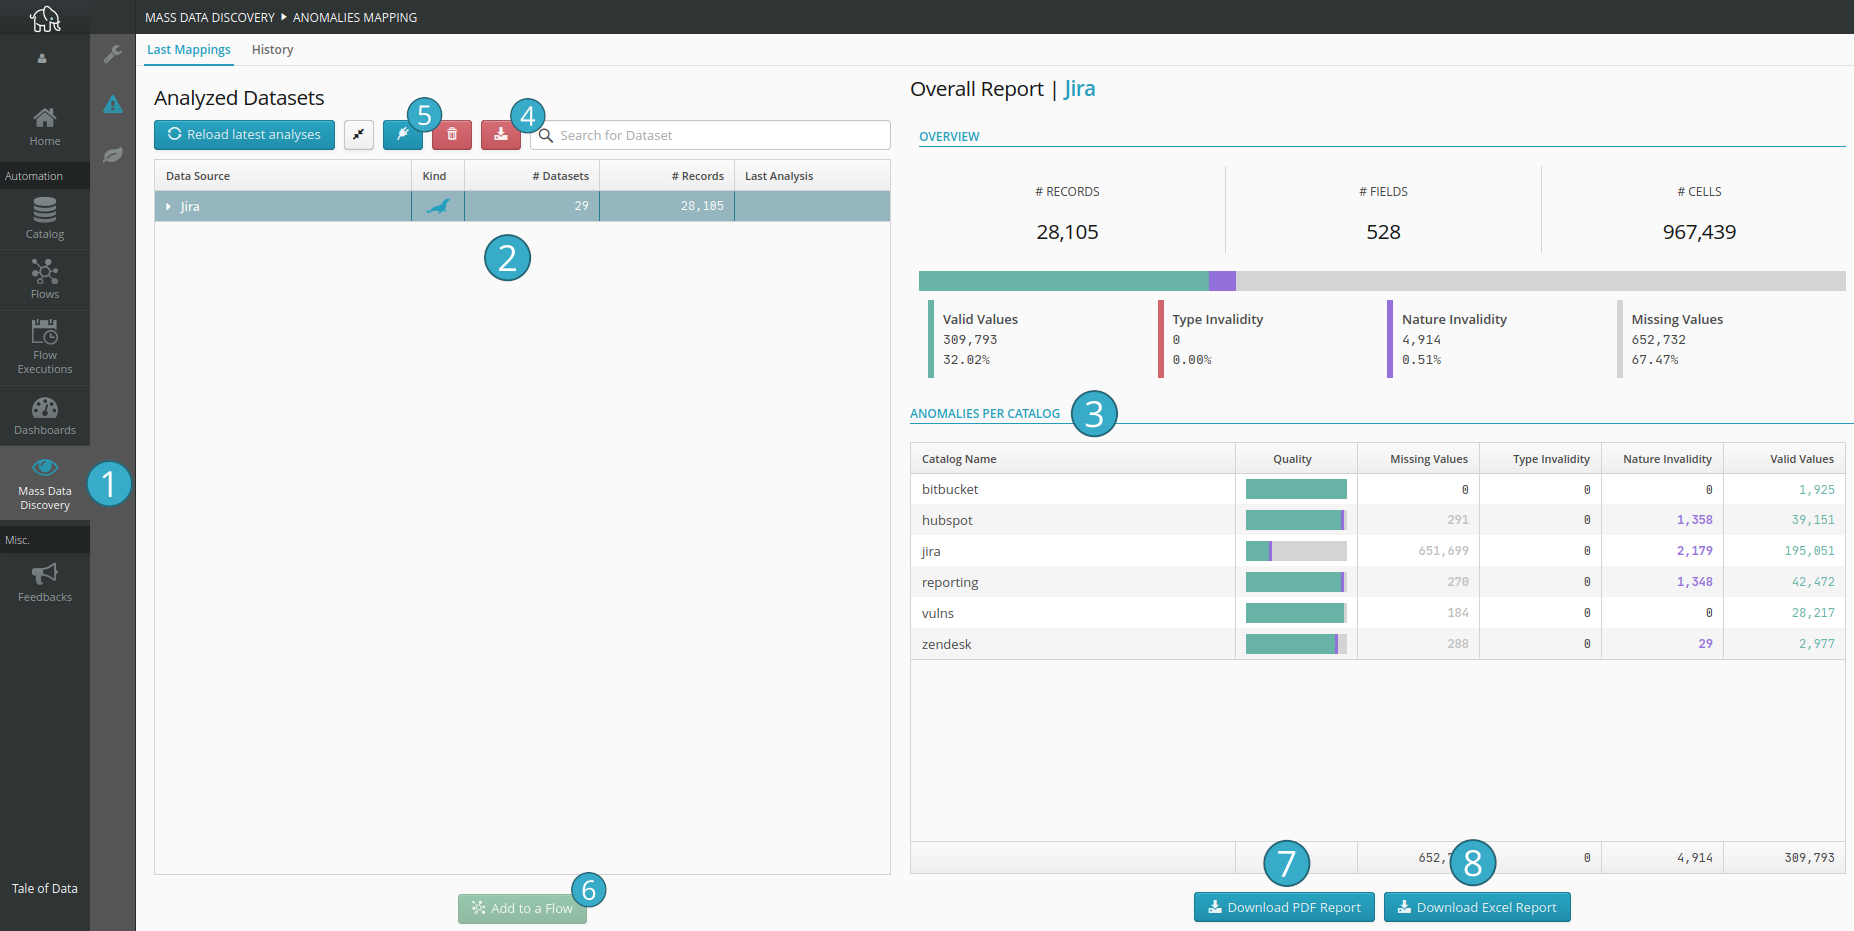
The updated view of the mapping of anomalies takes into account the latest analysis results.
The previously consolidated results are presented here in a manner suited to needs related to the typing of data :
Snapshot view of the mapping of anomalies.
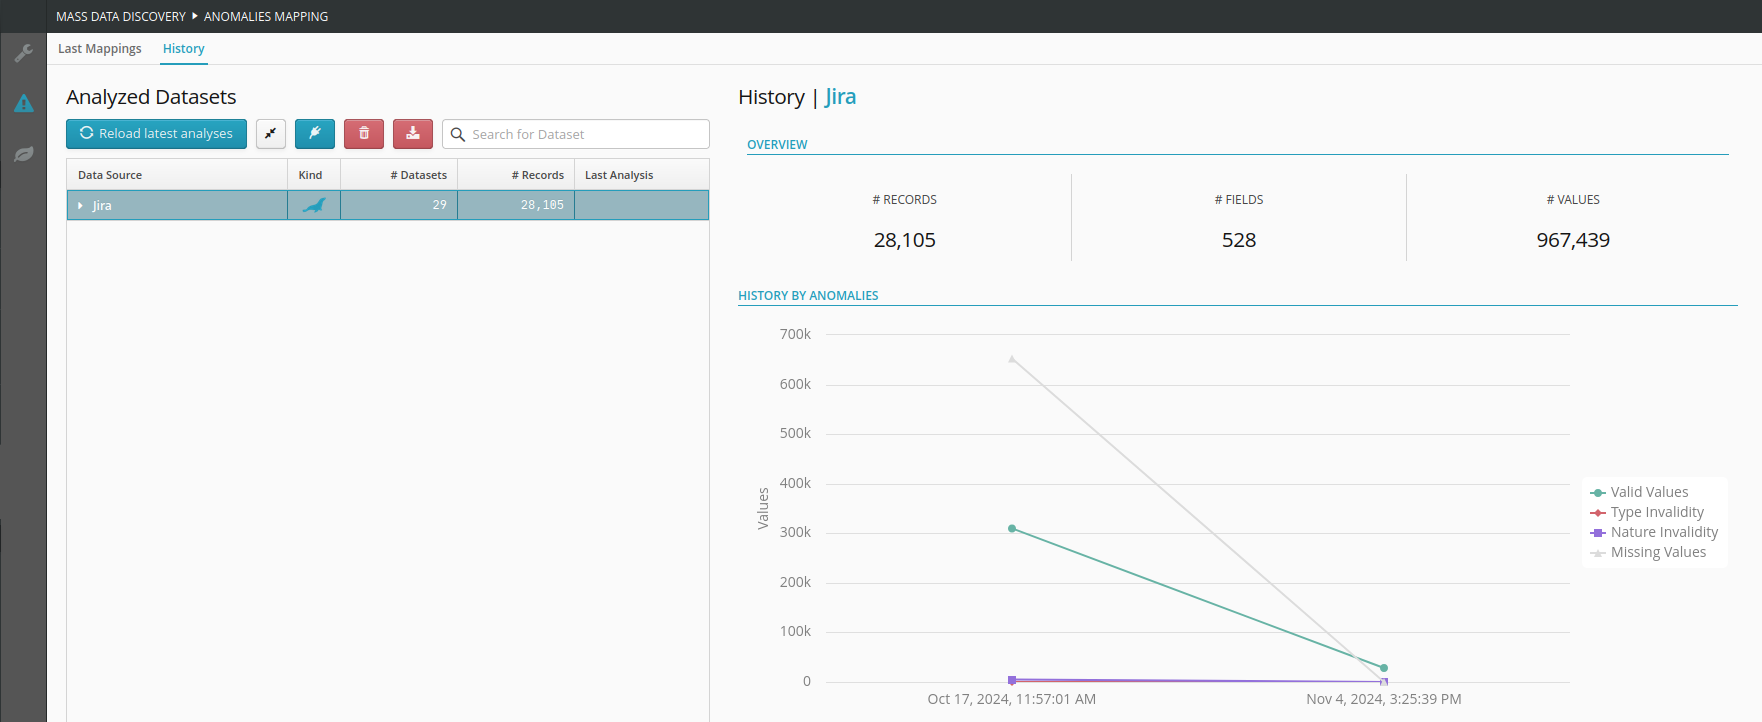
Historical view of the evolution of anomalies.
PDF Reports.
Excel reports for external exploitation.
Area presenting an overview of anomalies by data source and dataset
 .
.Area presenting a synthetic view of anomalies based on the selected data source or dataset: the data from sub-elements is aggregated at the level of the selected element
 .
.Button allowing to download the list of errors from the last analysis for the selected data source.

Button allowing to download the synthetic report of the anomaly mapping in PDF format (the data depends on the element selected in the left tree)
 .
.Button allowing to download the raw data of the anomaly mapping in Excel format (the data depends on the element selected in the left tree)
 .
.
The History is also accessible from the second tab. This is to view the evolution of the anomaly mapping over time for the selected dataset through the analyses performed.
12.4.3. Advanced Statistics
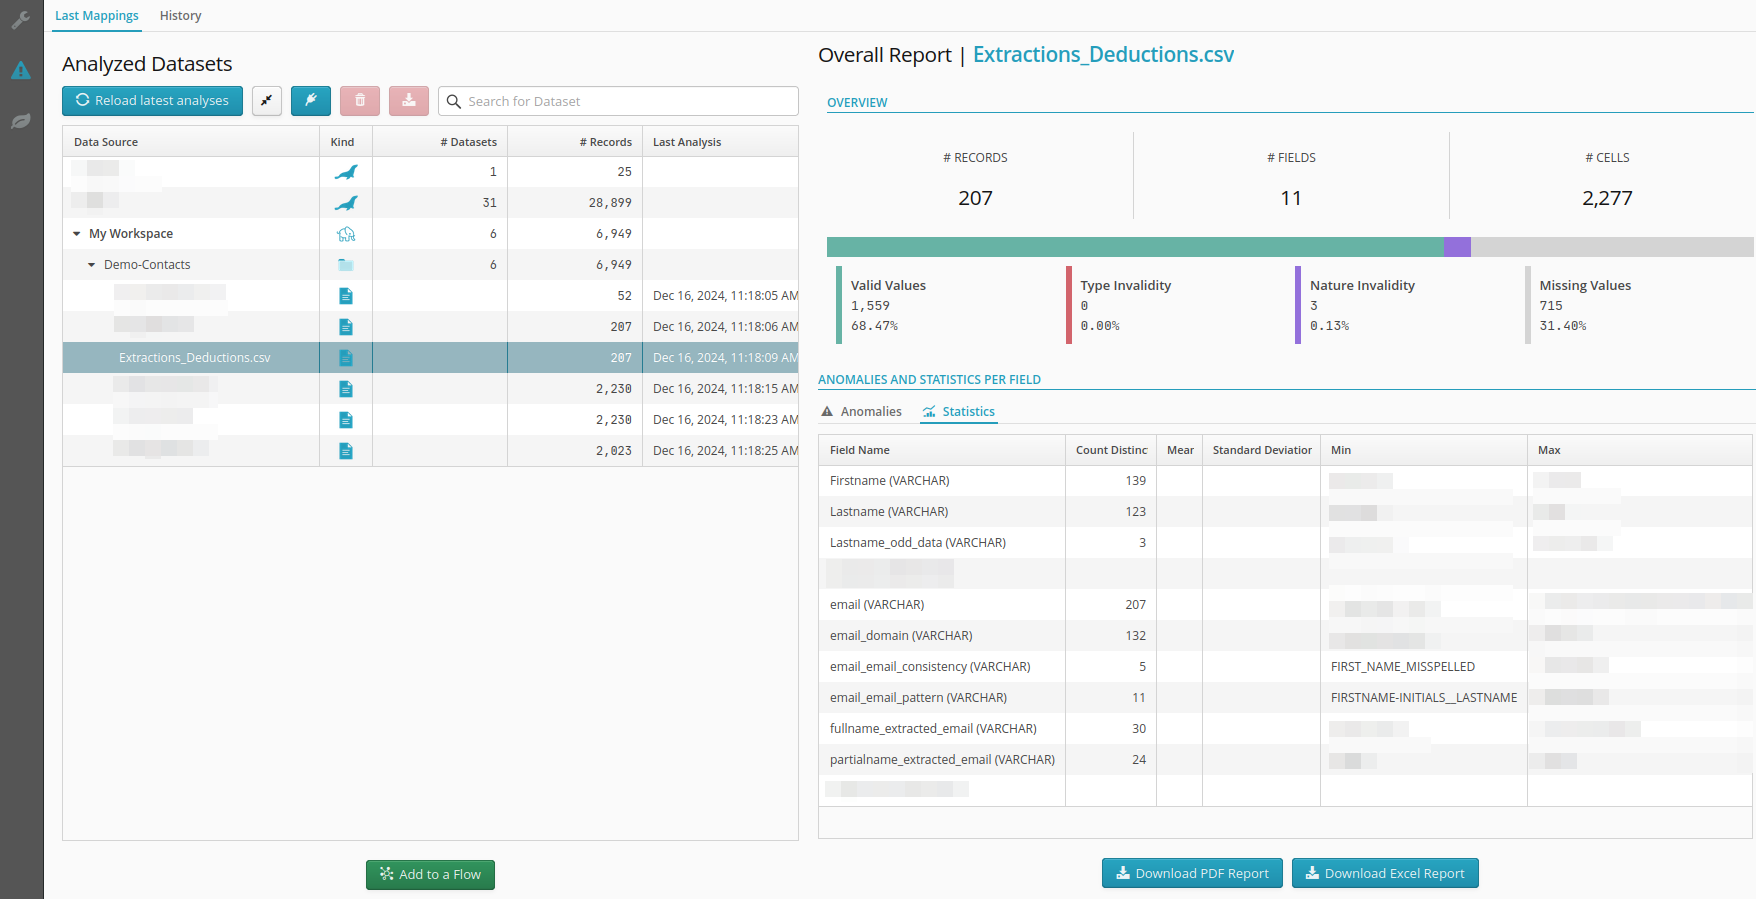
If the option to load advanced statistics has previously been selected, the result of the calculation of distinct values will then be displayed in an advanced statistics tab under anomalies and field statistics.
12.4.4. Semantic analysis of data
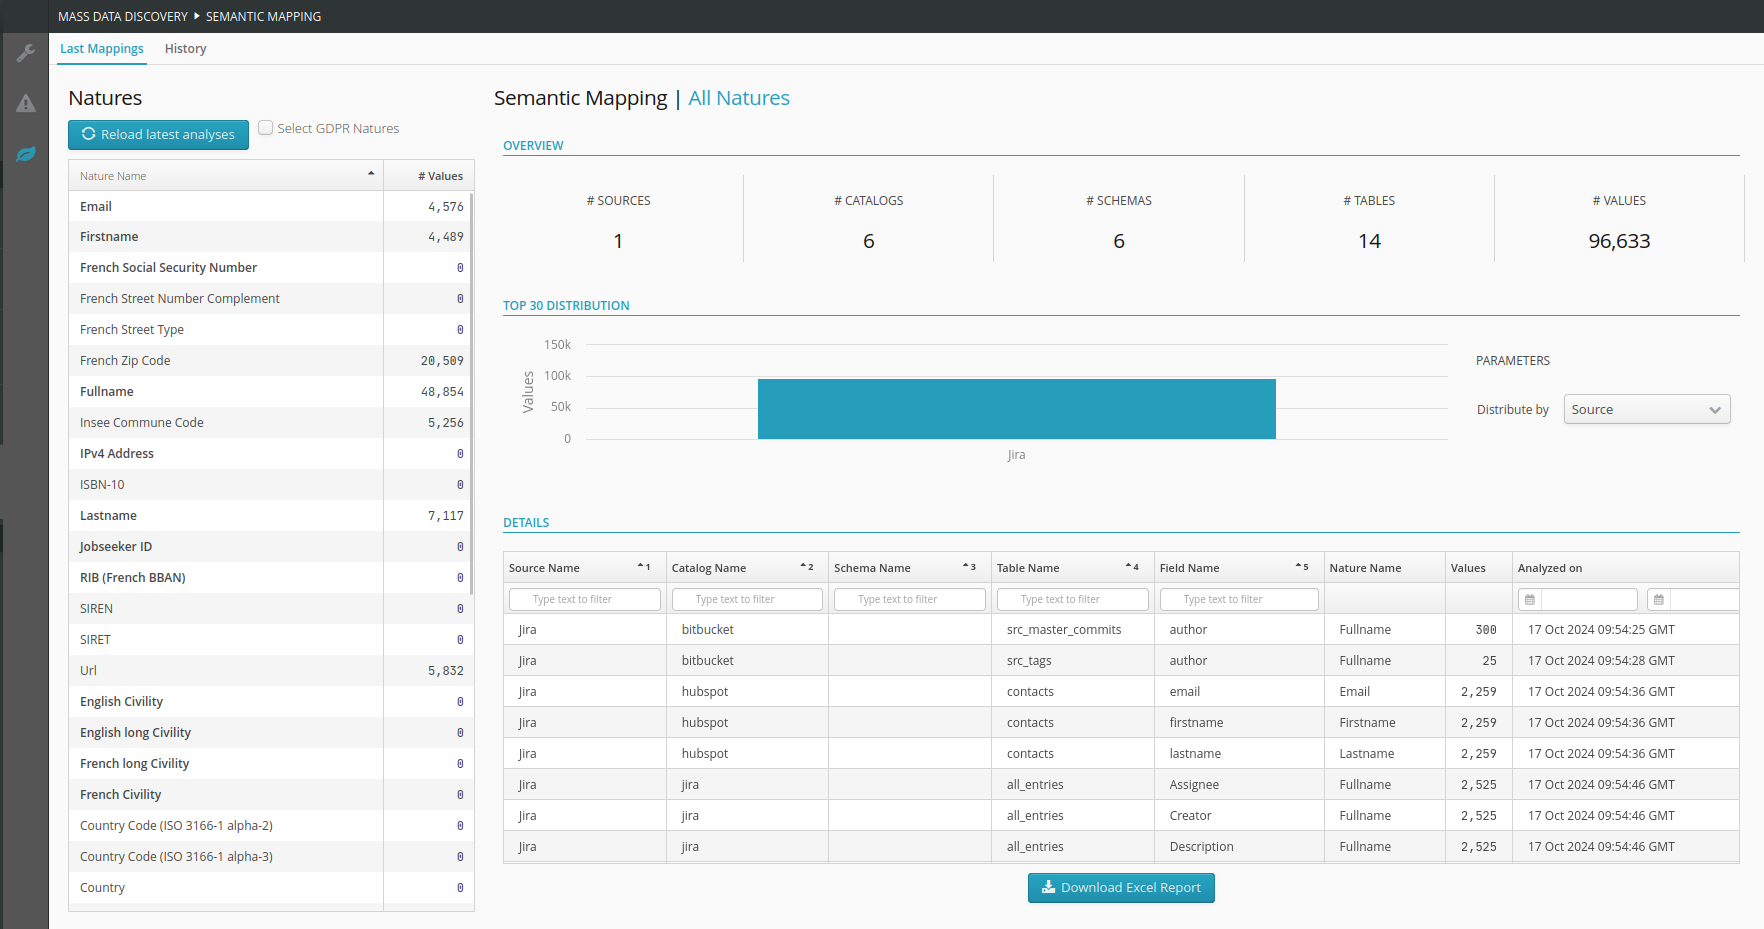
The updated view of the mapping of natures takes into account the latest analysis results. Consequently, only fields with a nature are displayed here.
The previously consolidated results are presented here in a manner suited to needs related to the nature of the data :
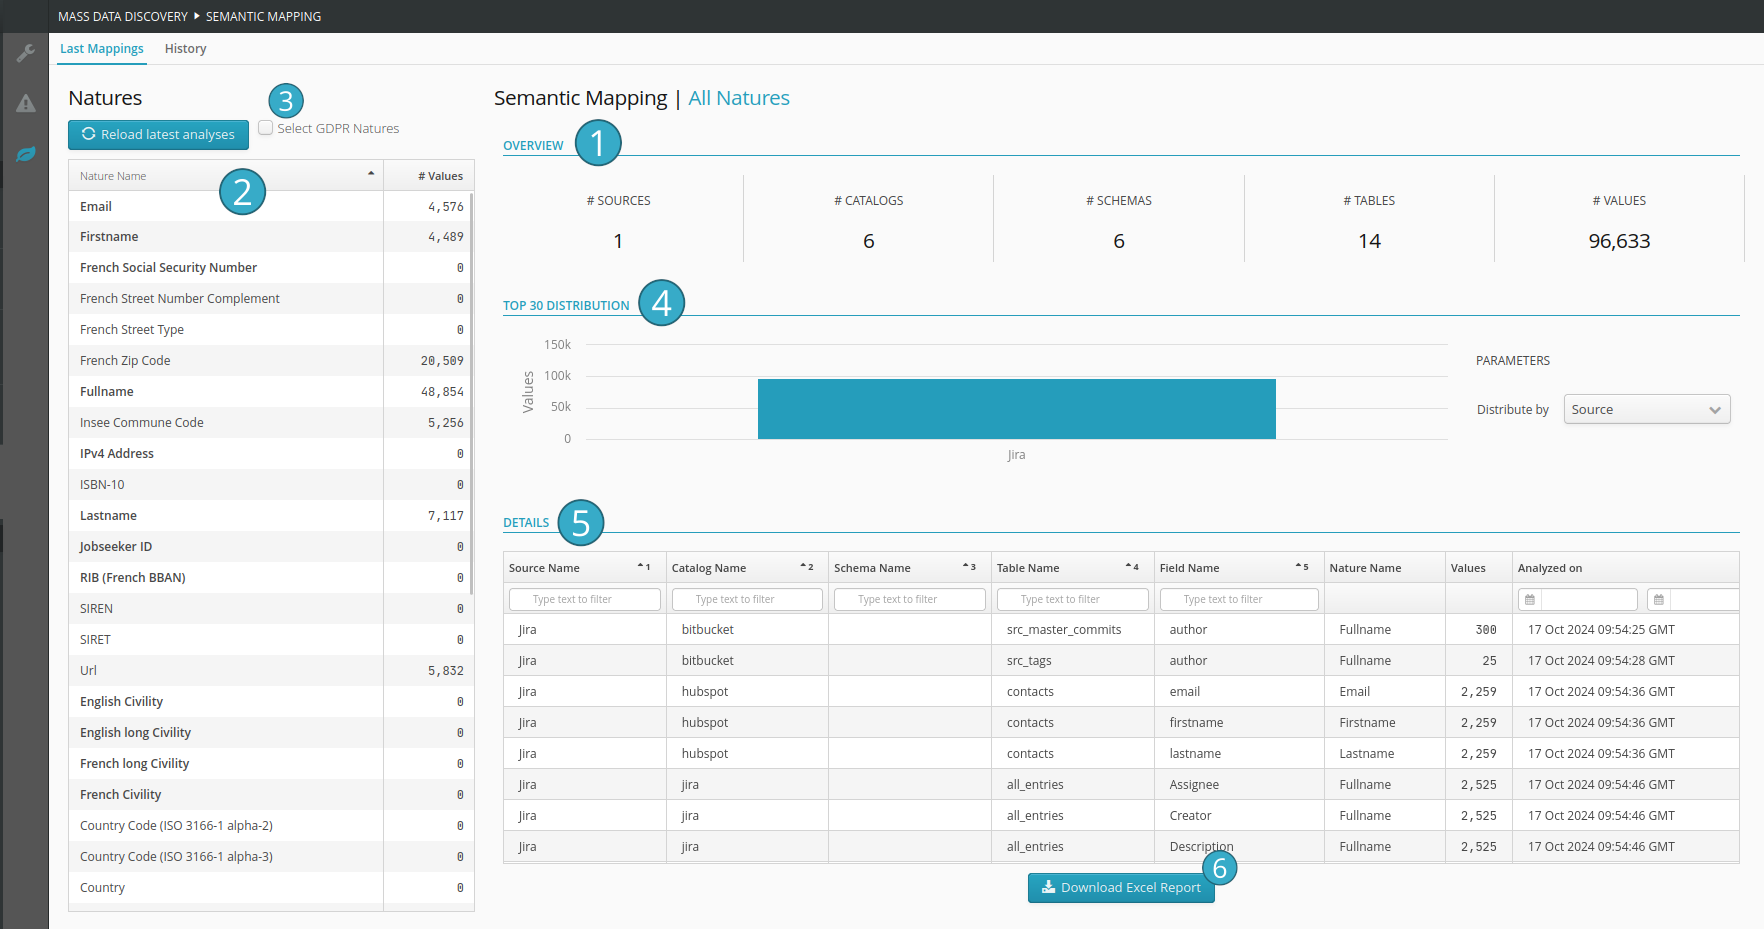
Snapshot view of the mapping of natures.
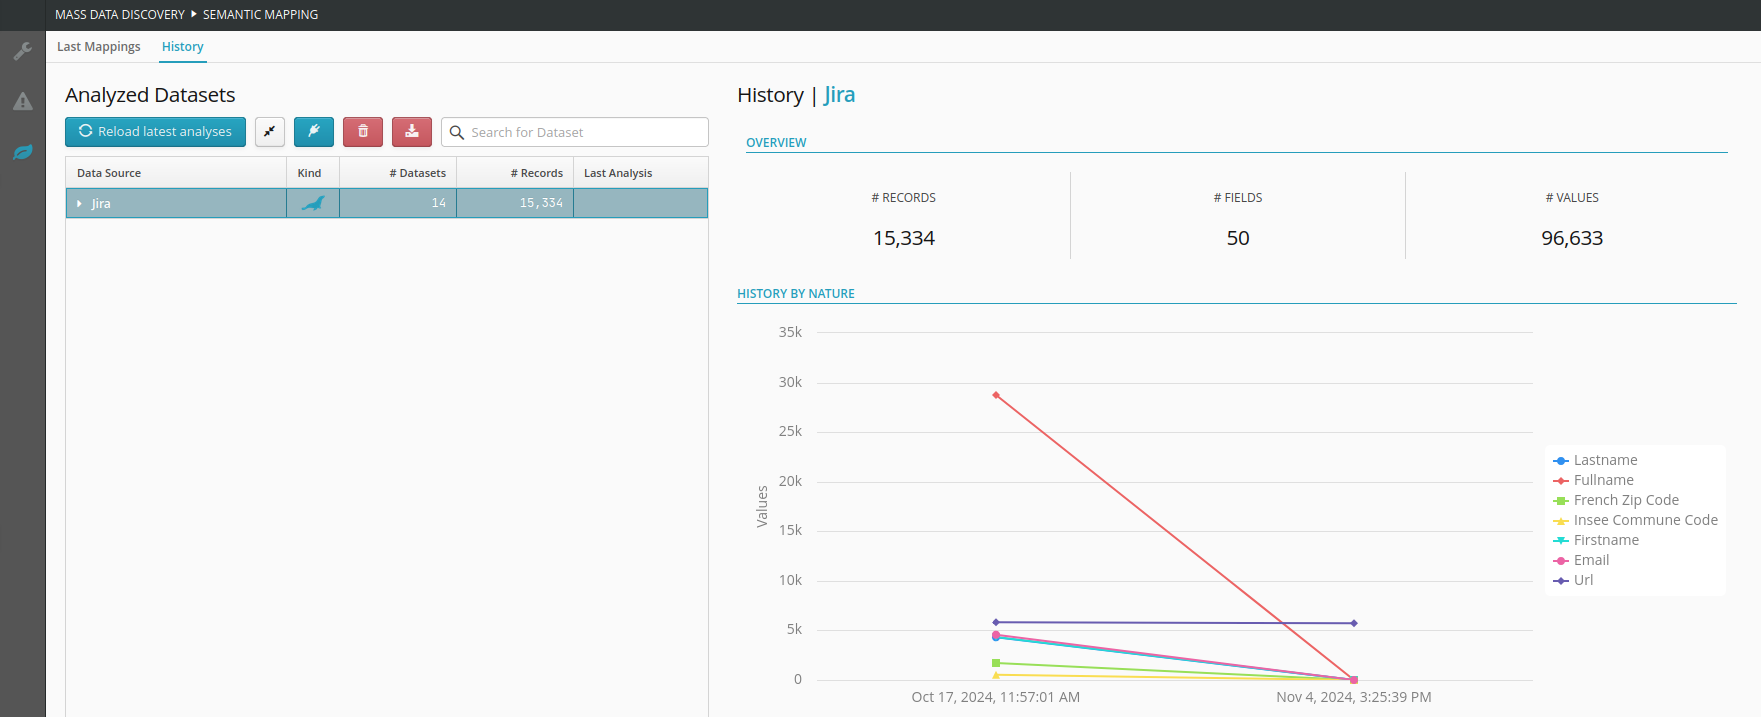
Historical view of the evolution of natures.
PDF Reports.
Excel reports for external exploitation.
Area presenting an overview of the number of data sources, catalogs, schemas, tables, and values present in the selected mapping of natures
 . In the absence of a selection, all results with a nature (GDPR and others) are displayed.
An area displaying all the natures. In bold the natures classified as GDPR (personal data) are shown in bold
 . Selecting one or more items allows you to filter the results (on the right side of the screen).
Button allowing to select/deselect directly the RGPD natures
 .
.Area presenting the number of values for the selected natures, distributed by data source
 . In the absence of selection, all results with a nature are displayed.
Area presenting the details of the mapping of natures by field
 . Only the fields with natures are displayed.
Button allowing to download the raw data of the mapping of natures in Excel format (the data depends on the element selected in the left table)
 .
.
The History is also accessible from the second tab. This allows you to view the evolution of the natures mapping over time for each analysis performed on the selected dataset. Only fields with a nature are displayed.
12.4.5. Exploitation of the raw data from analyses
In the Analysis Executions tab, it is possible to directly access the result located in the catalog with the shortcut Open.
This raw data can be exploited through flows in ToD for purposes such as monitoring, transformation, or reporting. Its ToD format also facilitates utilization through other tools (data catalog, MDM, etc.).
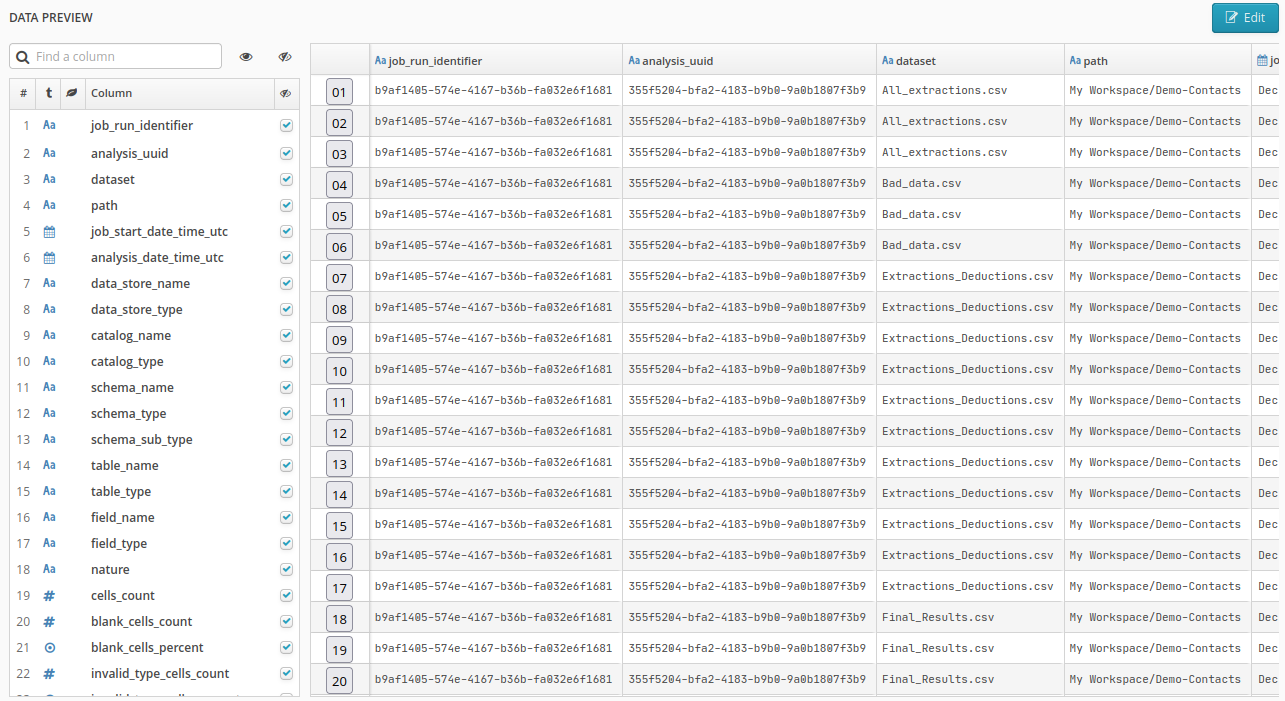
We detail below the structure of the fields exported by the MDD, once an analysis of this raw data has been performed (see the following screen).
Each column of each table is described by a line in the data export.
Tip
The fields concerned by advanced statistics will only be filled if the option to calculate them has been activated. In the opposite case, the corresponding cells will be empty but still present in the raw results of the analysis.
12.4.5.1. Details on the analysis and the studied table
- job_run_identifier
a UUID identifying the analysis run; it will be the same for all scanned columns within the same run
- analysis_uuid
UUID of the concerned analysis; it will be the same regardless of when the run occurs
- dataset
Name of the selected table
- path
Name of the path where the table is located
- job_start_date_time_utc
Start time of the launched processor
- analysis_date_time_utc
Start time of the executed analysis
- data_store_name
Name of the data source from which the catalog and table come
- data_store_type
Type of DMS of the data source
- catalog_name
Name of the catalog
- catalog_type
Type of catalog
- schema_name
Name of the selected file within the catalog in question, the database schema
- schema_type
The type of the selected schema (file or other)
- schema_sub_type
The format of the selected schema (e.g., CSV, if a CSV file)
- table_name
The name of the table, either the name of the dataset (without extension)
- table_type
The type of the table, either TABLE (if dataset)
12.4.5.2. Details on each column of the table
- field_name
The name of the identified column
- field_type
The type of the identified column
- nature
The nature of the identified column
- cells_count
The number of non-empty cells in the identified column
- blank_cells_count
The number of empty cells in the identified column
- blank_cells_percent
The percentage of empty cells relative to the total number of cells
- invalid_type_cells_count
The number of cells with invalid types in the identified column
- invalid_type_cells_percent
The percentage of cells with invalid types relative to the total number of cells
- invalid_nature_cells_count
The number of cells with invalid natures in the identified column
- invalid_nature_cells_percent
The percentage of cells with invalid natures relative to the total number of cells
- invalid_type_samples
Example of an invalid type
- invalid_nature_samples
Example of an invalid nature
12.4.5.3. Advanced statistics on each column
The following columns will be produced if the option advanced statistics has been set for the analysis.
- count_distinct
Count of the number of distinct values in the column
- mean
Calculation of the average value for numeric columns
- stddev
Calculation of the standard deviation (variation or dispersion) of values for numeric columns
- min
Minimum value of the column
- percentile_5
Calculation of the 5th percentile for numeric columns, below which 5% of observations fall
- percentile_25
Calculation of the 25th percentile for numeric columns, below which 25% of observations fall
- percentile_50
Calculation of the 50th percentile for numeric columns, below which 50% of observations fall
- percentile_75
Calculation of the 75th percentile for numeric columns, below which 75% of observations fall
- percentile_95
Calculation of the 95th percentile for numeric columns, below which 95% of observations fall
- max
Maximum value of the column
